
Linking scripts
One script reads the values another script shares - share.*, link.script, input.script, the point-in-time rule, statuses, plan slots and label spacing.
A script can read values that another script chooses to share. A pivot script shares its levels and a trend; a second script reads them, combines them with its own logic and puts its labels where the two agree. This page covers both sides: how a script shares values, how another script links to it and reads them, and the rules that keep the result honest about the past.
Two words are used throughout:
- A producer is a script that shares values with
share.*. - A consumer is a script that links to a producer with
link.scriptorinput.scriptand reads what it shares.
Only what a producer shares can be read. Its code, plots, drawings, inputs and log never cross a link.
#What a script can share
| Kind | What it is | Shared with | Read as |
|---|---|---|---|
| series | one number or true / false per bar: a trend score, a pressure reading, "in a squeeze" | share.series | h.<id>, with history: h.<id>[1] |
| event | "this happened on this bar", with a price, a side, a strength and a short text | share.event | h.events.<id>: the events delivered on this bar |
| level | a price, or a zone with a top and a bottom, that stays active until the producer ends it | share.level, share.level_end | h.levels.<id>: the levels active on this bar |
h stands for the consumer's name for the link, its handle.
#The producer: share.*
This script turns swing highs and lows into levels that stay until price closes through them. It shares the levels, an event for each new pivot and a simple trend score. Save it as Pivot Levels: the examples further down link to it by that name.
//@chartscript 1
indicator("Pivot Levels", { overlay: true, max_labels_count: 100 })
// Swing highs and lows become levels until price closes through them. Shared so other scripts can use them.
const span = input.int(5, "Bars on each side", { minval: 1, maxval: 50 })
const keepN = input.int(12, "Levels to keep", { minval: 1, maxval: 100 })

type Piv {
    price: float
    key: string
    up: bool        // true = a pivot low (support), false = a pivot high (resistance)
}

const ph = ta.pivothigh(high, span, span)
const pl = ta.pivotlow(low, span, span)

state live = array.new<Piv>()

// a pivot is KNOWN on this bar, though it sits `span` bars back: share it now, never earlier
if (!na(ph)) {
    const p = Piv.new(ph, "H" + str.tostring(time[span]), false)
    live.push(p)
    share.level("pivots", p.key, ph, { name: "PH", kind: "R", side: -1, strength: span })
    share.event("pivot", { price: ph, side: -1, back: span, text: "Pivot high" })
}
if (!na(pl)) {
    const p = Piv.new(pl, "L" + str.tostring(time[span]), true)
    live.push(p)
    share.level("pivots", p.key, pl, { name: "PL", kind: "S", side: 1, strength: span })
    share.event("pivot", { price: pl, side: 1, back: span, text: "Pivot low" })
}

// a level ends when a bar closes through it, or when too many are live (oldest first)
if (live.size() > 0) {
    for (let i = live.size() - 1 to 0) {
        const p = live.get(i)
        if ((p.up && close < p.price) || (!p.up && close > p.price)) {
            share.level_end("pivots", p.key)
            live.remove(i)
        }
    }
}
while (live.size() > keepN) {
    share.level_end("pivots", live.first().key)
    live.shift()
}

// a simple trend score: -1, 0 or 1, shared on every bar
const trend = math.sign(ta.ema(close, 21) - ta.ema(close, 55))
share.series("trend", trend, { title: "Trend (-1 / 0 / 1)" })

plot(ta.valuewhen(!na(ph), ph, 0), "Last pivot high", color.new(color.down, 40), 1, plot.style_stepline)
plot(ta.valuewhen(!na(pl), pl, 0), "Last pivot low", color.new(color.up, 40), 1, plot.style_stepline)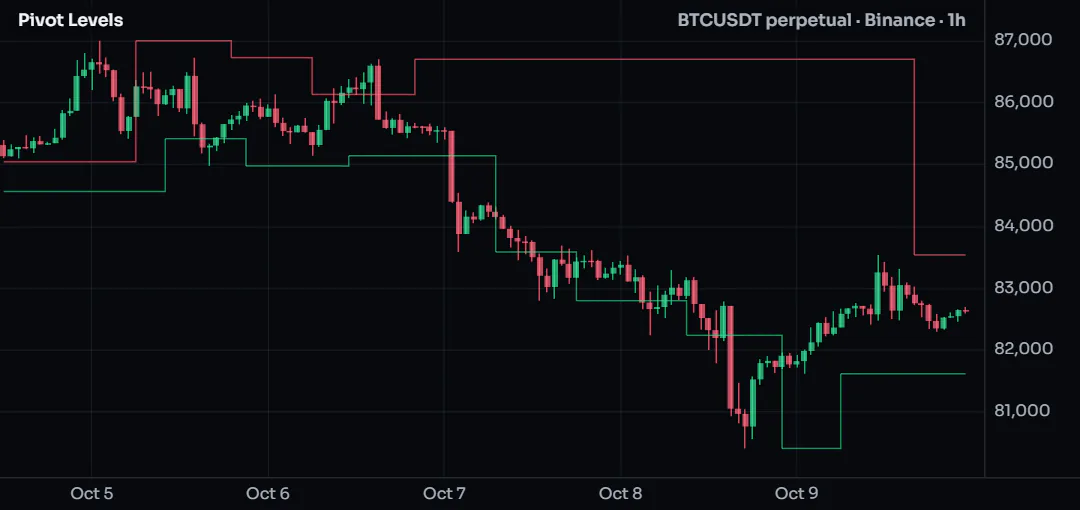
The rules:
- The id (
"pivots","pivot","trend") is a constant text: lower-case letters, digits and_, starting with a letter, at most 24 characters. One id has one kind (CS4111). The wordslevels,events,readyandstatusbelong to the handle and cannot be ids (CS4116). share.series(id, value, { title, format, precision })is written once per id, at the top level of the script, like a plot (CS4112 inside anif, a loop or a function). The value is a number or a bool, and the consumer reads it as the same type. It is not a plot: nothing is drawn and it has no row on the Style tab. Thetitleis the name people see when they pick the series as a source.share.event(id, { price, side, strength, text, back })may be called anywhere, at most 8 times per id on one bar (more are dropped, with one log line).sideis1(up, bullish, support),-1(down, bearish, resistance) or0.textis plain text, at most 64 characters.backsays how many bars back the event is about; see Point in time.share.level(id, key, price, { top, bottom, name, kind, side, strength })may be called anywhere. Thekey(a text or a whole number, such as"R1"or a bar time) names the level inside its id. Calling it again with the same key updates that level; a call that changes nothing costs nothing. Givetopandbottomfor a zone.nameandkindare your own short words, at most 24 characters each.share.level_end(id, key)ends a level. Ending a key that is not active writes one log line and is otherwise ignored.- A script can share up to 32 series, 8 event ids and 8 level ids (CS4114), and one id holds at most 500 active levels: one more ends the oldest, with one log line.
- On the live bar, what a script shares is taken back before each new update, like its drawings. Only what the bar's close shares stays.
- Values cannot be shared inside a request expression (CS4113), and a library cannot share: it has no bars of its own.
Sharing changes nothing else about a script: it draws and runs as before.
#The consumer: link.script
A consumer declares each producer once, at the top of the script, and reads its shares with a dot:
//@chartscript 1
const piv = link.script("@user/Pivot Levels@1")
indicator("RSI with a trend filter")
const r = ta.rsi(close, 14)
const turnUp = ta.crossover(r, 40)
plot(r, "RSI", color.accent)
hline(40, "Trigger", color.muted)
// keep the RSI signal only while the linked script's trend is up
plotshape(turnUp && piv.ready && piv.trend > 0, "Filtered long", { style: shape.circle, location: location.bottom, color: color.up })
No picture: this example reads another script through a link, so it draws only next to the script it reads.
The declaration. link.script(path, { inputs, at }) is written at the top level as a const of its own (CS4101 in a branch, a loop, a function or a let). It may come before indicator(...), next to the import lines, or after it.
The path is a constant text with three parts, the same form a library import uses:
@useris the author's handle. For your own script, write your own handle, or@userif you have not chosen one. For another member's script it must be the author's handle.Pivot Levelsis the name the script is saved under. It may contain spaces.@1is a saved version.@latestfollows new versions; see Versions.
The handle (piv above) gives these reads:
| Read | Type | Value |
|---|---|---|
piv.trend (a shared series) | series float, series int or series bool, as shared | the value on this bar; piv.trend[1] is the bar before |
piv.levels.pivots | array<level> | the levels active on this bar, sorted by price, low to high; a fresh array on every bar |
piv.events.pivot | array<link.event> | the events delivered on this bar; usually empty |
piv.ready | series bool | true when the producer has data for this bar |
piv.status | series string | "ok", or why not; see Ready and status |
A level and a link.event are built-in types with read-only fields:
| Type | Fields |
|---|---|
level | price (the line, or the middle of a zone), top and bottom (na for a line), name, kind, side (1, -1 or 0), strength (na when not given), since (the time of the bar it became known, in ms UTC), source (the producer's name) |
link.event | price, side, strength, text, back, source |
Events are read in a loop on the bar they arrive:
//@chartscript 1
const piv = link.script("@user/Pivot Levels@1")
indicator("Pivot marks", { overlay: true, max_labels_count: 100 })
for (const e of piv.events.pivot) {
    // the event arrives on this bar; the pivot it is about sits e.back bars earlier
    label.new(bar_index - e.back, e.price, e.text,
        { style: e.side < 0 ? label.style_label_down : label.style_label_up, size: size.small })
}
No picture: this example reads another script through a link, so it draws only next to the script it reads.
The producer's settings. By default the producer runs with its own default inputs. inputs sets them, by the names of the producer's input variables. A value is a constant or one of this script's own inputs; a link that uses your inputs comes after those input.* lines (CS4105 for a wrong name, type or value):
//@chartscript 1
indicator("Wide pivots", { overlay: true })
const span = input.int(10, "Bars on each side", { minval: 1, maxval: 50 })
const piv = link.script("@user/Pivot Levels@1", { inputs: { span: span, keepN: 20 } })
plot(piv.levels.pivots.size(), "Active pivot levels", { display: display.data_window })
No picture: this example reads another script through a link, so it draws only next to the script it reads.
More rules:
- The handle exists only when the script is compiled. It cannot be stored in a variable or an array, and in this release it cannot be passed into a function (CS4101). A function may read a handle declared above it directly, as in
function trendUp() { return piv.trend > 0 }. - A linked value cannot be read inside a request expression (CS4106).
- A script cannot link itself (CS4102), and scripts cannot link each other in a circle (CS4103).
- When it is checked. The editor checks a link as you type: the declaration itself, whether the producer exists and you may read it (CS4110), and whether it shares what you read (CS4104, which lists what the producer shares). A circle of links and a chain more than 3 scripts deep are checked when you save.
In the editor. After a handle and a dot, completion offers what the producer shares: its series, then levels, events, ready and status. A script that links or shares something gets a Links tab. It lists what the script shares, and each script it links with the version in use, what that script shares and what yours reads from it. The tab's Link a script… button (on a narrow screen it is also under More tools) lists your scripts and Community scripts that share values, with a search. Picking one adds the const … = link.script("@handle/Name@latest") line below your imports.
#Letting the member choose: input.script
input.script gives the same handle, but the member picks the producer in the script's settings. needs says what your script reads, and only scripts that share all of it are offered:
//@chartscript 1
indicator("Trend of a picked script")
const src = input.script("Trend source", { defval: "@user/Pivot Levels@1", needs: { series: ["trend"] } })
plot(src.ready ? src.trend : na, "Trend", color.accent, { style: plot.style_stepline })
No picture: this example reads another script through a link, so it draws only next to the script it reads.
needsis{ series: [...], levels: [...], events: [...] }, each a list of share ids. The handle offers exactly these reads; anything else is CS4104.- A series in
needsis a number unless you write its type:"squeeze:bool"or"count:int". A producer must share it as that type to be offered. defvalis the producer the script starts with, in the path form above. It may be left out: the handle then readsnaand the legend row says "No source chosen" until the member picks a script.- The picker starts on Default, your
defval, and then lists three groups: On this chart (scripts running on the chart), My scripts and Community (open-source scripts). Each line says what the script shares. A script that cannot be used is listed grayed, with the reason: "does not share levels:pivots" or "needs access". - Picking a script from On this chart reads that study as it runs, and Follow its settings is ticked: when the member changes that study's settings, the link follows. Unticked, the link keeps the settings the study had when it was picked.
- Removing a study that another script reads this way asks first: "Keep running it hidden?" Keep it running hidden takes the study off the chart and keeps the link; No, remove the link leaves the reading script with "No source chosen".
Use link.script when your script is written for one producer, and input.script when any script with the right shares will do.
#link.live and link.confirmed
at chooses what the consumer reads while the bar is still open:
at | On closed bars | On the live bar |
|---|---|---|
link.live (the default) | the producer's values of that bar | the producer's working values, the same as it shows. They can still change. |
link.confirmed | the same as link.live | a series reads the last closed bar's value, levels are the set as of the last closed bar, and there are no events. Nothing moves until the bar closes. |
To read both, declare two handles. The second one is free: both read the same run of the producer.
//@chartscript 1
const piv = link.script("@user/Pivot Levels@1")
const pivC = link.script("@user/Pivot Levels@1", { at: link.confirmed })
indicator("Trend, live and confirmed")
plot(piv.trend, "Trend (live)", color.muted, { style: plot.style_stepline })
plot(pivC.trend, "Trend (confirmed)", color.accent, { style: plot.style_stepline })
alert.on(pivC.trend > 0 && pivC.trend[1] <= 0, "Trend turned up")
No picture: this example reads another script through a link, so it draws only next to the script it reads.
Use link.confirmed for signals and alerts, for the reasons on Repainting. An alert that fires within the bar on a link.live read can fire on a value that later changes.
#Point in time: share a value when you know it
Every linked value is point in time: on a bar, the consumer sees exactly what the producer knew on that bar. A series gives that bar's value, the levels are those active on that bar, and the events are those delivered on that bar. Nothing from a later bar ever reaches an earlier one.
This matters most for anything a script finds late. A pivot high with 5 bars on each side is only known 5 bars after the high. A script may draw its label back on the bar that made the high, because drawings are a picture. Drawings are not shared. To share the pivot, share it on the bar you know it, and say how far back it sits:
const ph = ta.pivothigh(high, 5, 5)      // not na on the bar the pivot is confirmed, 5 bars after the high
if (!na(ph)) {
    // the picture may point back at the bar that made the high
    label.new(bar_index - 5, ph, "PH", { style: label.style_label_down, size: size.small })
    // the shared values go out now, on the bar the pivot is known
    share.event("pivot", { price: ph, side: -1, back: 5, text: "Pivot high" })
    share.level("pivots", time[5], ph, { name: "PH", kind: "R", side: -1 })
}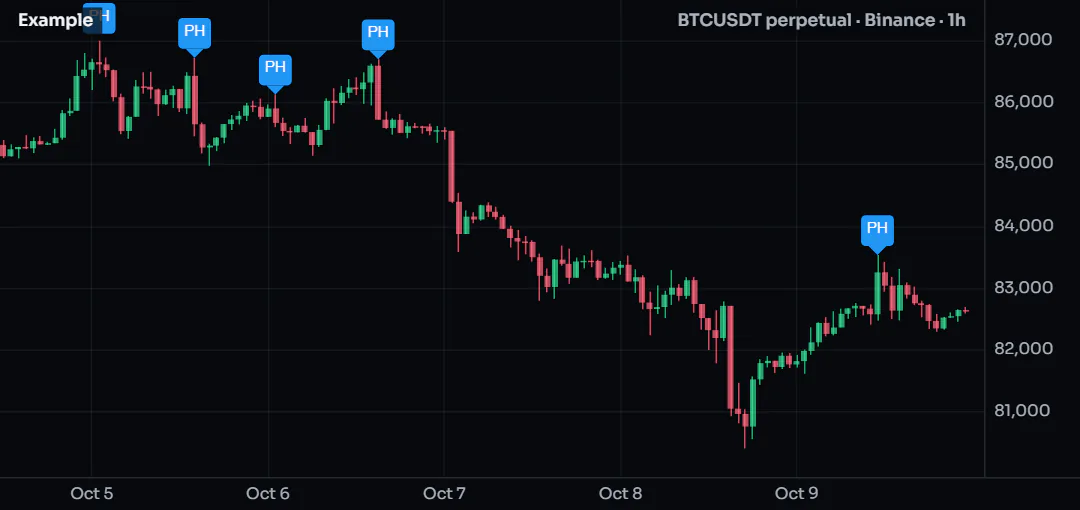
The consumer receives the event and the level on this bar, 5 bars after the high, exactly as it would have live. e.back and lv.since tell it where and since when. A consumer's history is then what it could really have known, bar by bar.
| What the producer does | What the consumer sees |
|---|---|
| Shares a series | That bar's value on each bar. On the live bar it moves with the producer; link.confirmed gives the closed value. |
| Finds something late (a pivot, a divergence) | The event or level on the bar it was shared, never on the bar it is about. Use back. |
Reads a higher timeframe with request.developing | The value moves on the live bar, and the consumer sees that move. link.confirmed gives the closed value. |
Shares a level only inside if (barstate.islast) | The level only on the last bar, and nothing on history. The editor shows hint CS4115 on the producer. |
//@chartscript 1
indicator("Developing middle", { overlay: true })
if (barstate.islast) {
    share.level("dev", "mid", hl2)
}
plot(hl2, "Middle")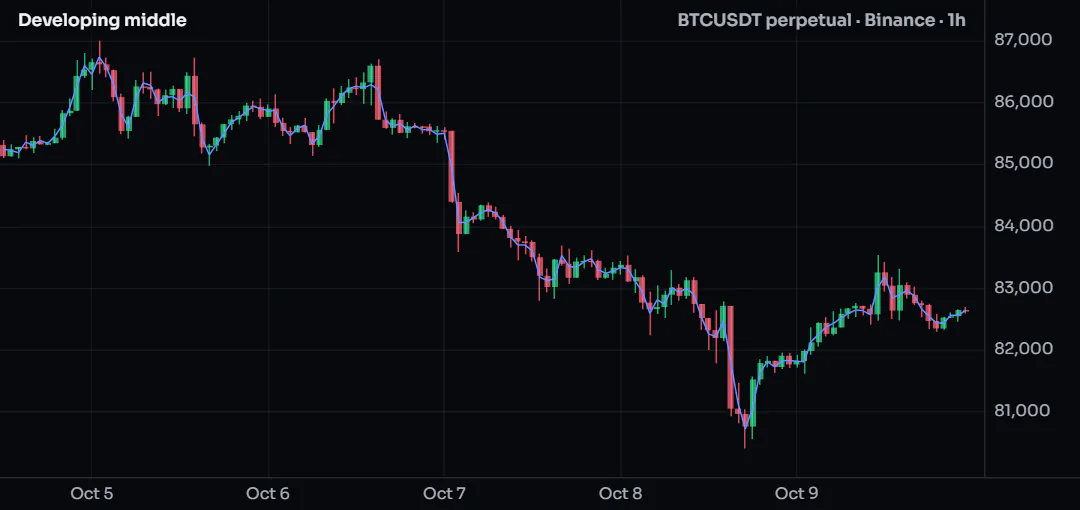
#Ready and status
A link that cannot give values never stops your script and never opens an error dialog. Its series read na, its level and event arrays are empty, ready is false, and status says why:
status | Meaning | The consumer's legend row says |
|---|---|---|
"ok" | The producer ran and has values. | "← Pivot Levels" |
"loading" | The producer has not finished its first run yet. | "Waiting for Pivot Levels" |
"no access" | The viewer may not read this producer; see Who can link what. | "No access to Pivot Levels" |
"plan" | The link is past the viewer's plan; see Plan slots. | "Pivot Levels: past your plan’s links (Beginner: 3 slots)" |
"error" | The producer stopped with an error, or the script or version it names is gone. The consumer keeps running. | "Pivot Levels is not running" or "Pivot Levels is no longer available" |
"stale" | Kept for a later release. Nothing reports it today. |
The legend row of a consumer names each script it reads ("← Pivot Levels"), so the member can see where its values come from and why one is missing.
ready is also false on bars the producer has no bar for, for example bars older than its history. Values are matched to your bars by bar time.
Guard your logic with ready, so a missing producer reads as "no opinion" and not as a value:
//@chartscript 1
const piv = link.script("@user/Pivot Levels@1")
indicator("Trend with a status")
plot(piv.ready ? piv.trend : na, "Trend", color.accent, { style: plot.style_stepline })
if (barstate.islast && !piv.ready) {
    // say in the legend row why there is no value
    legend.info("Pivot Levels: " + piv.status, "The linked script gives no values on this bar.", true)
}
No picture: this example reads another script through a link, so it draws only next to the script it reads.
#Who can link what
To read a producer, the viewer of the consumer must be allowed to read it. In this release:
| The producer is | Can it be linked? |
|---|---|
| Your own script, private or published in any way | Yes. You always read your own scripts. |
| Another member's open-source Community script | Yes, at a version its author has published. |
| Another author's protected script, including ChartDeck's own (the ChartDeck Cipher scripts, Stacked Imbalances) | Not yet. |
| An invite-only or paid script, also one you have access to | Not yet. |
| Another member's private script | No. |
- Saving a script that links something you cannot read fails with CS4110: "it was not found, or you cannot use it". The message is the same whether the script does not exist or is not yours to read.
- A link is judged for each viewer. If you publish a consumer that links one of your own protected scripts, it works for you; every other member gets
naand the status"no access"for that link, and nothing else about the producer. - Publishing a consumer: every script it links must itself be a published Community script, at a published version. Publish the producer first. The same holds for the default of an
input.script. - Shared values can be recorded by anyone who runs a consumer, exactly like plotted values. Share outputs, not the raw numbers you consider your edge.
- If an author unpublishes a producer, scripts that already link it keep working and nobody new can link it. If a moderator removes it, its links read
"no access".
#Versions: a number or latest
@8names one saved version. It never changes until you edit the path and save again.@latestfollows the newest version that is compatible: one that still shares everything your script reads, with the same kinds and types. For another member's script it is the newest published version. A new version that adds shares, renames a title or changes its code is compatible. One that removes or renames a share you read, or changes its kind or type, is not: your script stays on the newest version that still fits, and its legend row says so ("Pivot Levels 9 changed its shares; using 8"). A consumer picks up a new version the next time it loads on a chart.- A version that a saved version of another script links cannot be deleted, and a script that is linked cannot be deleted. Older saved versions of the consumer count too.
#Plan slots
Each consumer script has a number of link slots, set by the plan. In this release every link costs 3 slots:
| Beginner | Plus | Pro | Elite | |
|---|---|---|---|---|
| Link slots per script | 3 | 6 | 12 | 24 |
| Producers one script can read | 1 | 2 | 4 | 8 |
- What counts is a producer run: a script, a version and a set of inputs. Two handles on the same run, for example
link.liveandlink.confirmed, cost once. The same script with other inputs is another run. - Links past the slots still compile. They read
nawith the status"plan", in the order they are declared, so put the link you need most first. - On a chart it is the plan of the member viewing the consumer. For a script alert it is the plan of the alert's owner.
- A producer that is not on the chart runs hidden: it draws nothing and does not count toward your indicators per chart. The consumer's legend row marks it "(hidden)". A producer that is already on the chart with the same version and settings is not run twice.
Limits that are the same on every plan:
| Limit | Value | Past it |
|---|---|---|
| Links declared in one script | 24 producer runs | CS4109 |
| Depth: a producer may itself link producers | 3 levels below the consumer | CS4107 |
| Producer runs behind one consumer, nested ones included | 8 | the deepest read na with "plan" |
| Shares per script | 32 series, 8 event ids, 8 level ids | CS4114 |
| Events per id on one bar | 8 | more are dropped; one log line |
| Active levels per id | 500 | the oldest ends; one log line |
| Level and event changes kept per id in one run | 20,000 | the oldest are folded away: older bars of a consumer read no events and an empty level set; one log line |
A linked group is not free: each producer is a script that runs. A consumer with many heavy producers loads all of them.
#Levels and placement helpers
Shared levels are plain values, and a few built-in functions work on sets of them. They give the same answer on the chart, on ChartDeck's servers and in an alert.
| Function | Gives |
|---|---|
level.merge(a, b) | two sets as one, sorted by price |
level.nearest(levels, price, { side }) | the closest level, or na; side: 1 only at or above the price, -1 only at or below |
level.count_near(levels, price, distance) | how many levels lie within distance of the price; a zone counts when the price is inside it |
level.cluster(levels, tolerance, { min_count, min_sources }) | zones where levels agree: each zone is a level whose top and bottom are the outer levels, price their mean, strength the number of different sources and name the names joined with + |
level.new(price, { top, bottom, name, kind, side, strength, source }) | a level of your own, for example to give levels from several links one family name in source |
place.free_price(price, taken, gap, { direction, max_steps }) | the nearest price to price, stepping by gap, that keeps at least gap from every price in taken |
tolerance, distance and gap are prices. Use market-sized values such as ta.atr(14) * 0.25, so a script behaves the same on every market. min_sources: 2 is what makes a zone mean "two scripts agree" and not "two lines of one script".
They work on your own levels too:
const mine = array.new<level>()
mine.push(level.new(ta.highest(high, 50), { name: "High 50", kind: "R", side: -1, source: "range" }))
mine.push(level.new(ta.ema(close, 200), { name: "EMA 200", source: "trend" }))
const zones = level.cluster(mine, ta.atr(14) * 0.5, { min_sources: 2 })
const above = level.nearest(mine, close, { side: 1 })
plot(na(above) ? na : above.price, "Nearest level above", color.muted)
plot(level.count_near(mine, close, ta.atr(14)), "Levels within one ATR", { display: display.data_window })
plot(zones.size(), "Zones", { display: display.data_window })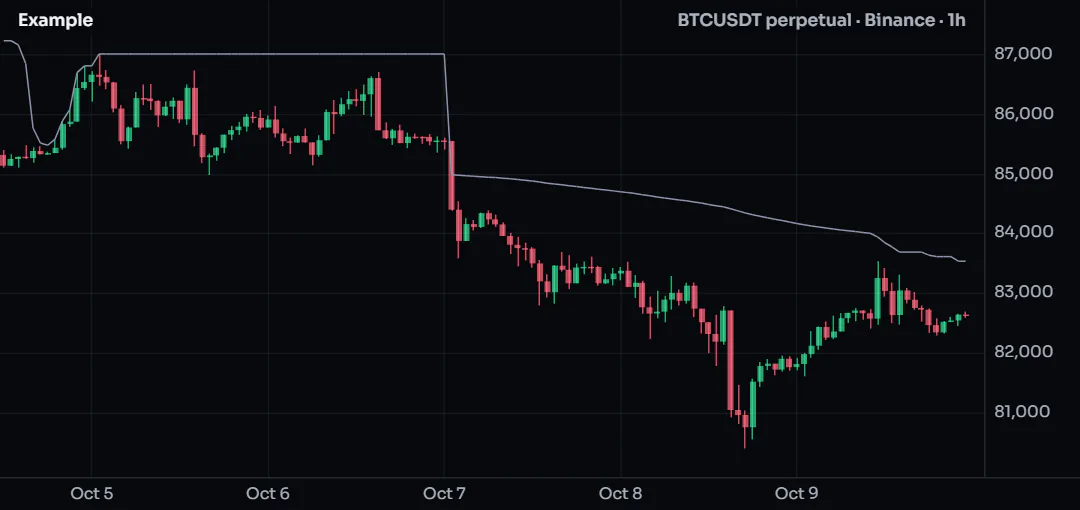
#A whole example: confluence zones
A second producer first. It shares yesterday's high and low, on the first bar of the new day, when they are known. Save it as Day Levels:
//@chartscript 1
indicator("Day Levels", { overlay: true })
// Yesterday's high and low. They are KNOWN on the first bar of the new day (UTC): that is the bar they are shared on.
state dayHigh: float = na
state dayLow: float = na
state prevHigh: float = na
state prevLow: float = na
state days = 0

if (dayofmonth != dayofmonth[1]) {
    days += 1
    // the first day on the chart may start in its middle: wait for a whole one
    if (days >= 2) {
        prevHigh = dayHigh
        prevLow = dayLow
        share.level("day", "PDH", prevHigh, { name: "PDH", kind: "R", side: -1 })
        share.level("day", "PDL", prevLow, { name: "PDL", kind: "S", side: 1 })
    }
    dayHigh = high
    dayLow = low
} else {
    dayHigh = na(dayHigh) ? high : math.max(dayHigh, high)
    dayLow = na(dayLow) ? low : math.min(dayLow, low)
}

plot(prevHigh, "Previous day high", color.new(color.down, 30), { style: plot.style_stepline })
plot(prevLow, "Previous day low", color.new(color.up, 30), { style: plot.style_stepline })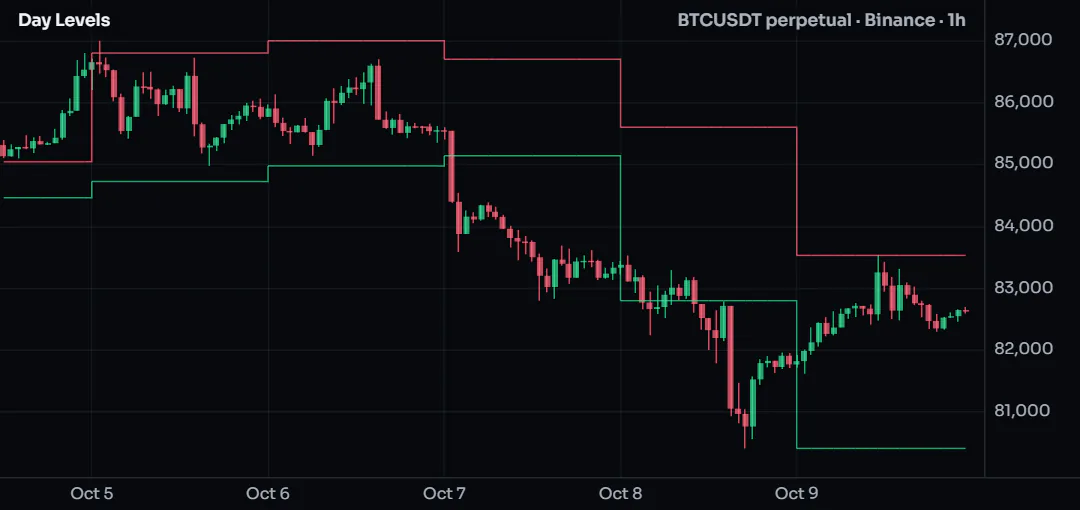
The consumer links both producers. One is fixed in code, the other is picked by the member. It finds the zones where a pivot level and a day level agree, boxes them, labels them without overlap, and marks a bar that closes up at such a zone with the trend:
//@chartscript 1
const day = link.script("@user/Day Levels@1")                               // fixed in code
const dayC = link.script("@user/Day Levels@1", { at: link.confirmed })      // the same run, closed-bar reads
indicator("Confluence Zones", { overlay: true, max_boxes_count: 30, max_labels_count: 30 })
const piv = input.script("Pivot source", { defval: "@user/Pivot Levels@1",
                                           needs: { levels: ["pivots"], series: ["trend"] } })
const tolAtr = input.float(0.35, "Zone width (x ATR)", { minval: 0.05, maxval: 2, step: 0.05 })
const minHits = input.int(2, "Scripts needed for a zone", { minval: 2, maxval: 6 })

const atr = ta.atr(14)
const all = level.merge(piv.levels.pivots, day.levels.day)
const zones = level.cluster(all, atr * tolAtr, { min_sources: minHits })   // two SCRIPTS must agree, not two lines

state boxes = array.new<box>()
state tags = array.new<label>()

if (barstate.islast) {
    for (const b of boxes) { b.delete() }
    for (const t of tags) { t.delete() }
    boxes.clear()
    tags.clear()

    const taken = array.new<float>()
    const bias = piv.trend
    for (const z of zones) {
        const col = z.side > 0 ? color.up : z.side < 0 ? color.down : color.accent
        boxes.push(box.new(bar_index - 50, z.top, bar_index + 5, z.bottom,
            { bgcolor: color.new(col, 85), border_color: color.new(col, 40) }))
        // logic: keep our own labels at least half an ATR apart (the same on the chart, on the server and in alerts)
        const y = place.free_price(z.price, taken, atr * 0.5, { direction: z.price > close ? 1 : -1 })
        taken.push(y)
        const strong = (z.side > 0 && bias > 0) || (z.side < 0 && bias < 0)
        tags.push(label.new(bar_index + 6, y, z.name + " ×" + str.tostring(z.strength) + (strong ? " ✓" : ""),
            { style: label.style_label_left, color: col, textcolor: color.white, size: size.small,
              avoid: true, avoid_group: "conf",          // looks: the chart also keeps them clear of other scripts' labels
              tooltip: "Levels: " + z.name }))
    }
}

// a signal: a bar closes up near levels of both scripts, with the shared trend (closed-bar reads: it never repaints)
const near = level.count_near(level.merge(piv.levels.pivots, dayC.levels.day), close, atr * tolAtr) >= minHits
const upBar = ta.crossover(close, open)
const buy = near && piv.trend > 0 && upBar
plotshape(buy, "Confluence buy", { style: shape.triangleup, location: location.belowbar, color: color.up, avoid: true })
alert.on(buy, "Confluence buy", "{{ticker}} closed up at a confluence zone")
No picture: this example reads another script through a link, so it draws only next to the script it reads.
What it shows: two producers (one fixed, one picked), a merge and a cluster that count scripts and not lines, a second handle on the same run for closed-bar reads, label spacing in the logic (place.free_price) and label spacing in the picture (avoid). On a plan with slots for only one producer (see Plan slots), the third link (piv) reads na with the status "plan".
#Keeping labels apart: avoid
Two scripts that label the same price put their labels on top of each other. avoid: true on a label or a marker asks the chart to sort that out when it draws:
const ph = ta.pivothigh(high, 5, 5)
if (!na(ph)) {
    label.new(bar_index - 5, ph, "PH", { style: label.style_label_down, size: size.small, avoid: true, avoid_group: "pivots" })
}
plotshape(ta.crossover(close, ta.sma(close, 20)), "Cross up",
    { style: shape.triangleup, location: location.belowbar, color: color.up, avoid: true })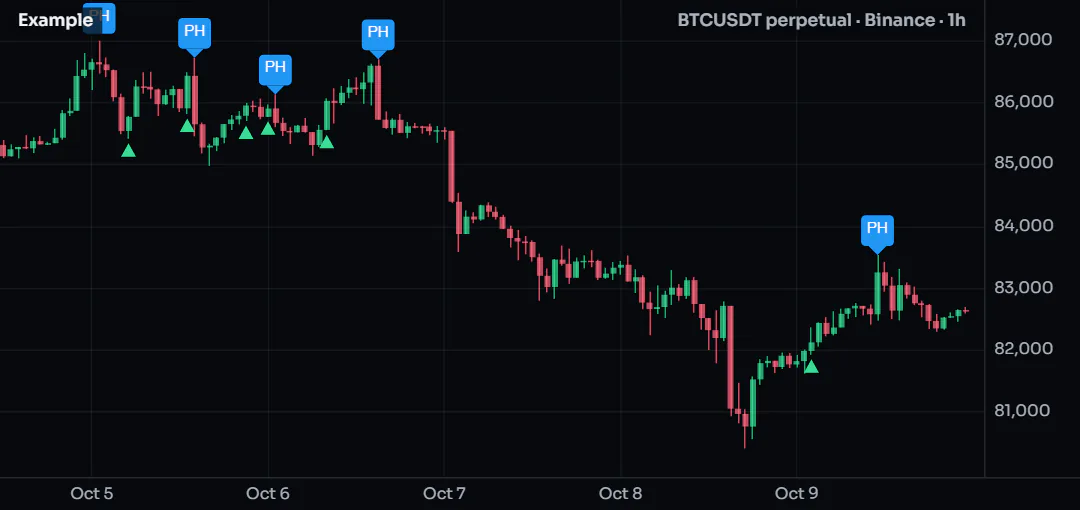
- It works on
label.new,plotshapeandplotchar. - The chart nudges an
avoidlabel or marker up or down, away from the otheravoidlabels and markers and from the level tags of any script on the same pane. Their order by price is kept, and a moved label gets a short leader back to its real price. avoid_group: "name"keeps this script's labels and markers with the same name together: they move as one stack.- Both options are constants. A label or marker without
avoidis drawn exactly where it always was. - It changes pixels only. The script never learns where its label went:
label.get_ystill returns the price you gave. Values, alerts and runs on ChartDeck's servers are untouched, so two scripts can never chase each other.
That is also why there is no way for a script to read what other scripts drew on the chart. The answer would depend on the viewer's pane, zoom and settings, an alert has no pane at all, and two scripts avoiding each other would never settle. Logic reads what producers share; tidiness is the chart's job. To space your own labels in the logic, use place.free_price.
#Without code: a source from another study
A script that takes its source from input.source can read another study's values with no link in its code:
//@chartscript 1
indicator("RSI of any source")
const src = input.source(close, "Source")
plot(ta.rsi(src, 14), "RSI", color.accent)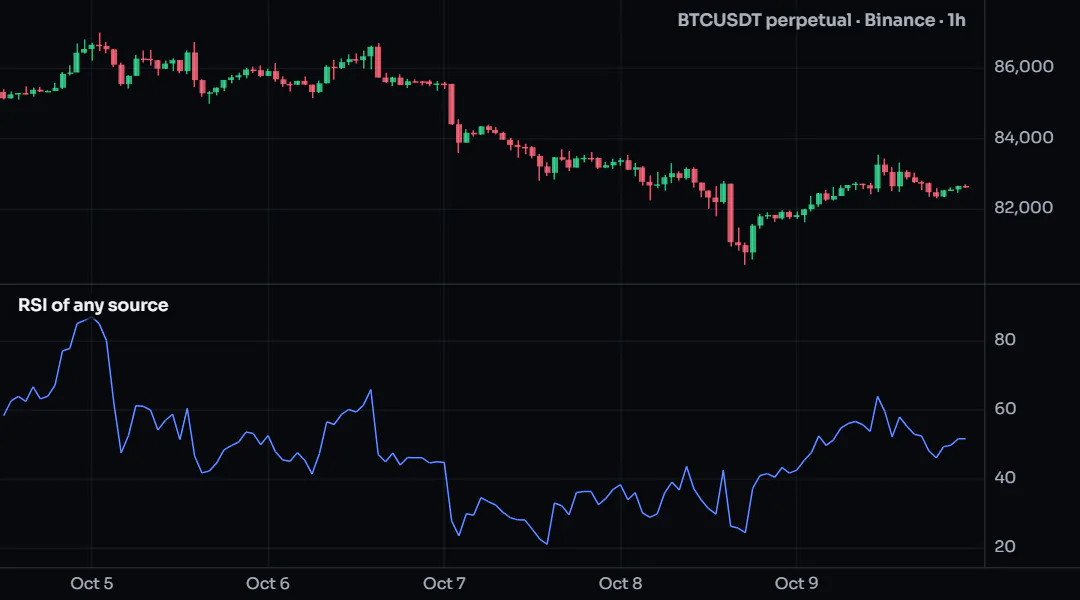
In the script's settings, the source menu lists the prices first and then From other studies on this pane: the plots of the built-in studies on that chart, and the plots and shared series of the scripts on it. Pick one, and src is that value bar by bar. The legend row then names the study it reads.
- The other study must be on the same chart, and it is not run a second time.
- A script study must run in your browser to be read this way: your own scripts and open-source Community scripts. Protected scripts cannot be picked yet.
- If the study is removed from the chart, the menu shows Study not on this chart and the source reads
na. - Inside a request expression, a source that points at another study reads
close: the request runs on other bars. - This costs no link slot.
#Links and libraries
Both let scripts work together, in different ways:
| Library | Link | |
|---|---|---|
| Shares | code: functions, types, enums, constants | values: series, events, levels |
| Written as | import * as T from "@user/Tools@1" | const h = link.script("@user/Name@1") |
| Runs | inside the importing script, as part of it | as itself, with its own bars, inputs and state |
| The other script | a library(...), with export | an indicator(...), with share.* |
| Version | an exact number | an exact number, or @latest |
| Costs | the library's code counts toward your script's size | link slots; the producer is one more script running |
Use a library to reuse a calculation. Use a link to read the result of a script that is already tuned and running, without copying its logic.
#Alerts and previews
- A script alert on a consumer runs its producers with it on ChartDeck's servers, on the same bars as the chart, so the alert sees what the chart shows. Links are resolved with the alert owner's access and plan. If the owner loses access to a producer, the alert is paused with a notice.
- Preview on chart works for a consumer: the preview runs the producers its links name.
#Not in this release
Script links arrive in stages. This release does not have:
- Protected, paid and invite-only producers. A link to one reads
nawith"no access"for everyone but its author. This includes ChartDeck's own protected scripts: the ChartDeck Cipher scripts and Stacked Imbalances. - Other timeframes and markets. A link runs on the chart's market and timeframe.
tfandmarketonlink.scriptare refused (CS4110). - Passing a handle into a function. Read the handle inside the function instead.
- More than 8 producer runs behind one consumer, on any plan.
#Errors
| Code | When |
|---|---|
| CS4101 | a link is not a top-level const, its path is not a constant text, or the handle is used as a value |
| CS4102, CS4103, CS4107 | a script links itself; scripts link in a circle; links go more than 3 scripts deep |
| CS4104 | the producer does not share what the script reads |
| CS4105 | a wrong name, type or value in inputs |
| CS4106, CS4113 | a linked value read, or a value shared, inside a request expression |
| CS4109 | more than 24 links in one script |
| CS4110 | the producer was not found or cannot be linked; tf / market |
| CS4111, CS4112, CS4114, CS4116 | share ids: two kinds for one id; share.series in a branch or twice; too many shares; an id that is not allowed |
| CS4115 | a hint: a level shared only on the last bar |