Drawings
Labels, lines, boxes, polylines and line fills drawn from code: creating, updating with setters, deleting, coordinates, extend, caps and keeping them fast.
Plots, fills and shapes are outputs: one value per bar, declared once at the top of the script. Drawings are different. A drawing is an object you create from your code, at any bar and any price, whenever you like: inside an if, in a loop, in a function. Once created it stays on the chart until you delete it or the script makes too many of its kind, and you can move it, recolor it or change its text at any time.
That makes drawings the right tool for things that are not "a value on every bar": a label on each pivot with its price, a trend line between two swing points, a box around a range, a path through a list of points.
| Type | Draws | Create with |
|---|---|---|
label | Text in a bubble, or a small shape, at one point | label.new |
line | A straight line between two points, optionally extended | line.new |
box | A rectangle between two bars and two prices, optionally with text | box.new |
polyline | A line through many points, straight or curved, open or closed | polyline.new |
linefill | The area between two lines | linefill.new |
tag | A level: its line with the name written on the chart, or a name tag and a price tag at the right edge; an optional sub-label | tag.new |
drawing | A Long or Short position, drawn by the chart's own position tool (zones, prices, R:R); the member can keep a copy | drawing.position |
Tables are drawing objects too; they have their own page: Tables. Positions and reading the member's own drawings have theirs: Positions and your drawings.
#Labels and lines
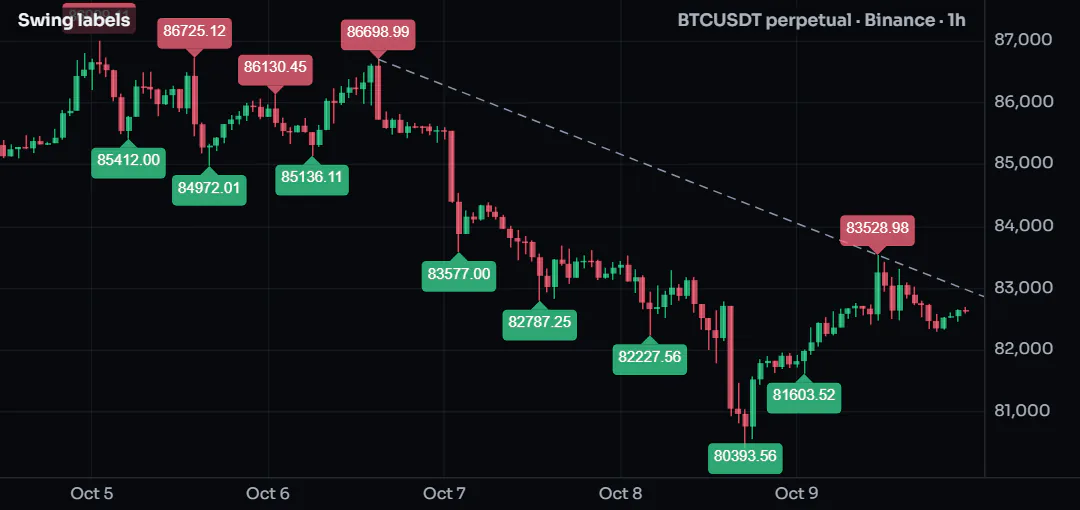
This script labels every swing high and low with its price and joins the two most recent swing highs with a line that extends to the right:
//@chartscript 1
indicator("Swing labels", { overlay: true, max_labels_count: 200 })
const span = input.int(5, "Bars each side", { minval: 1 })

const ph = ta.pivothigh(high, span, span)
const pl = ta.pivotlow(low, span, span)

state lastHigh: float = na
state lastHighBar: int = na
state trend: line = na

if (!na(ph)) {
    label.new(
        bar_index - span,
        ph,
        str.tostring(ph, format.mintick),
        { style: label.style_label_down, color: color.new(color.down, 25), textcolor: color.white, size: size.small }
    )
    // join this swing high to the previous one
    if (!na(lastHigh)) {
        line.delete(trend)
        trend = line.new(
            lastHighBar,
            lastHigh,
            bar_index - span,
            ph,
            { extend: extend.right, color: color.muted, style: line.style_dashed }
        )
    }
    lastHigh = ph
    lastHighBar = bar_index - span
}

if (!na(pl)) {
    label.new(
        bar_index - span,
        pl,
        str.tostring(pl, format.mintick),
        { style: label.style_label_up, color: color.new(color.up, 25), textcolor: color.white, size: size.small }
    )
}
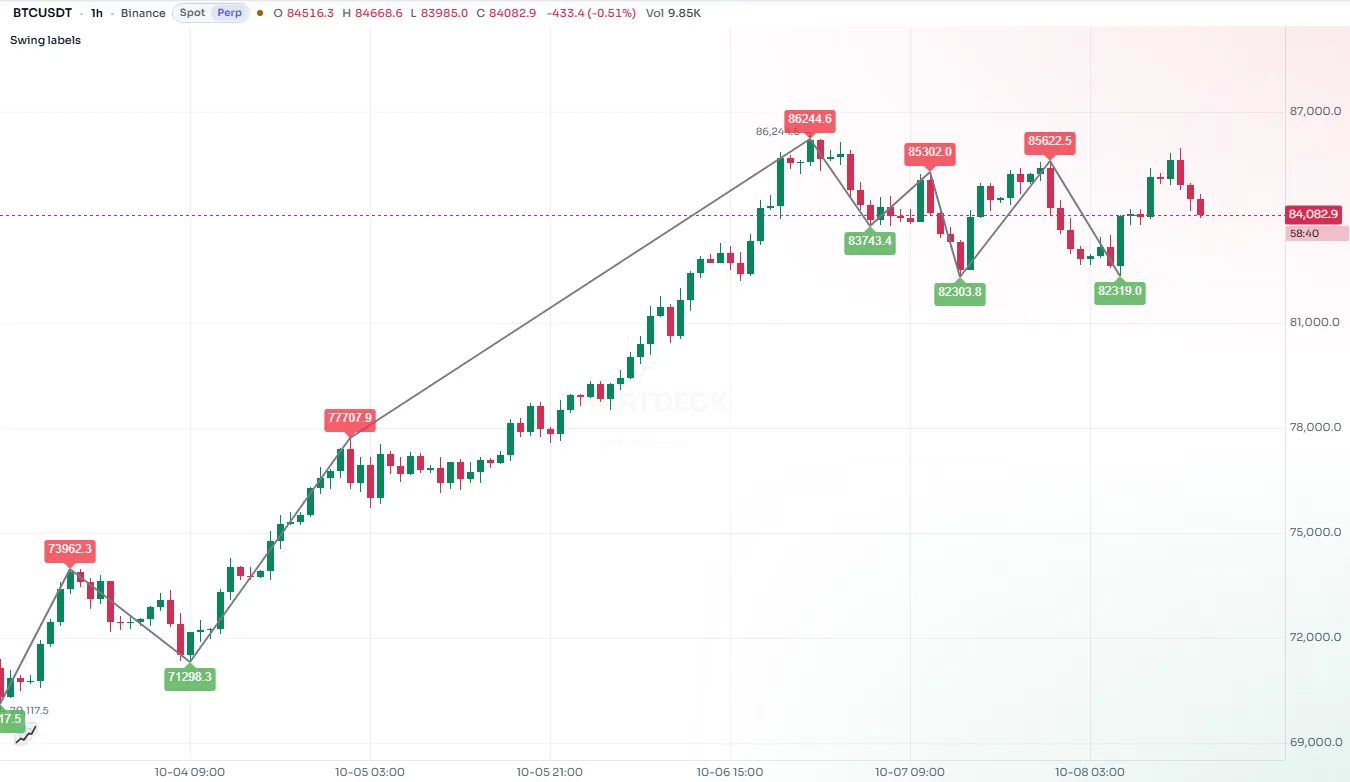
A few things to notice:
- The pivot is confirmed
spanbars after it happened, so the label goes atbar_index - span, back on the bar that made the high. - The trend line is kept in a
statevariable. Each new swing high deletes the old line and draws a new one, so there is only ever one. max_labels_count: 200inindicator()lets the script keep 200 labels instead of the default 50.
#Coordinates
Every drawing is placed with an x (where along the time axis) and a y (a price).
x is a bar index by default (xloc: xloc.bar_index): bar_index is the current bar, bar_index - 10 ten bars back, bar_index + 5 five bars into the future. With xloc: xloc.bar_time, x is a time in milliseconds instead, such as time or time_close. Times are handy when you know when something happened rather than how many bars ago.
A drawing may extend past the last bar into the empty space on the right; ChartDeck draws it there using the chart's bar spacing.
y is a price on the script's scale. For labels, yloc can override it:
yloc | The label sits |
|---|---|
yloc.price | At the y you gave (the default) |
yloc.abovebar | Above the bar's high (y is ignored) |
yloc.belowbar | Below the bar's low (y is ignored) |
#Chart points
A chart.point holds both kinds of x (a time and a bar index) plus a price. Every constructor accepts points instead of separate numbers, and polylines need them:
| Function | Makes a point at |
|---|---|
chart.point.now(price) | The current bar |
chart.point.from_index(index, price) | A bar index |
chart.point.from_time(time, price) | A time |
chart.point.new(time, index, price) | Both (either x may be na) |
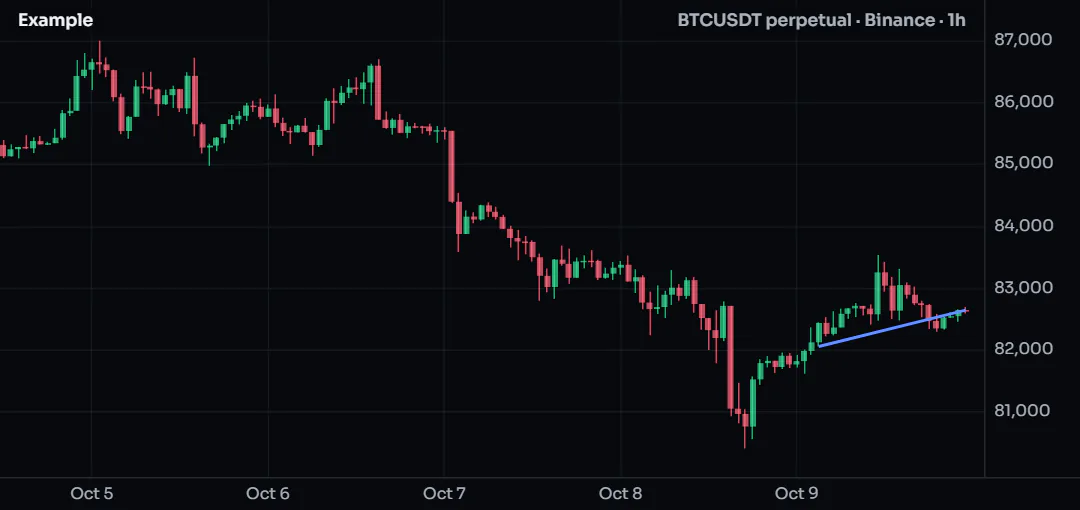
if (barstate.islast) {
    const a = chart.point.from_index(bar_index - 20, low[20])
    const b = chart.point.now(close)
    line.new(a, b, { color: color.accent, width: 2 })
}
#Create once, then update
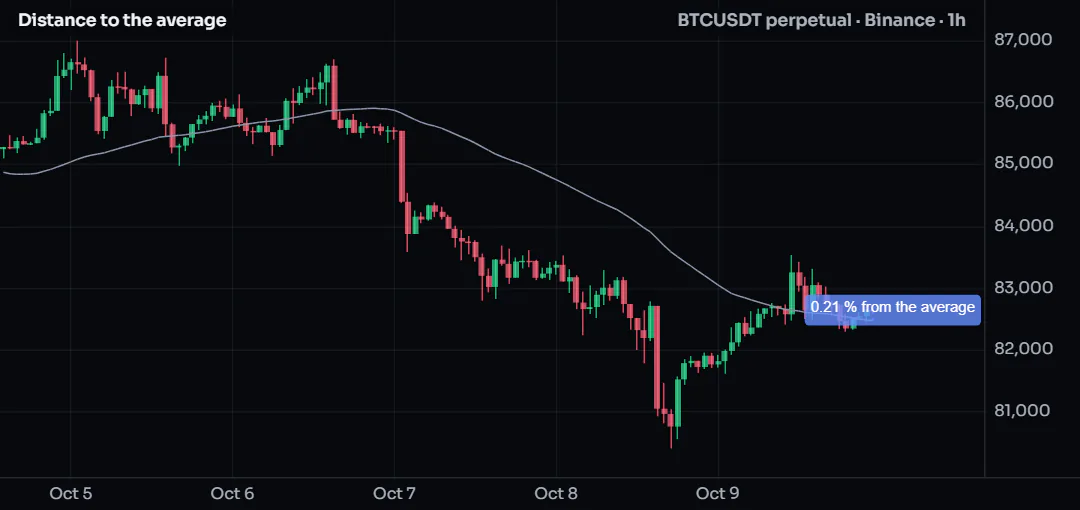
A script runs once on every bar. If you call label.new on every bar, you get a new label on every bar, which is rarely what you want and slow besides. For a drawing that should exist once, such as a line at the current price or a label with the latest reading, declare it with state and change it with setters:
//@chartscript 1
indicator("Distance to the average", { overlay: true })
const len = input.int(50, "Length", { minval: 1 })
const avg = ta.sma(close, len)
plot(avg, "Average", color.muted)

// created once, on the first bar; moved and rewritten on later bars
state tag: label = label.new(
    na,
    na,
    "",
    { style: label.style_label_left, color: color.new(color.accent, 20), textcolor: color.white, size: size.small }
)
state link: line = line.new(na, na, na, na, { color: color.accent, style: line.style_dotted })

if (barstate.islast) {
    const pct = (close - avg) / avg * 100
    tag.set_xy(bar_index + 2, close)
    tag.set_text(str.tostring(pct, "#.##") + " % from the average")
    link.set_xy1(bar_index, avg)
    link.set_xy2(bar_index, close)
}
Updating on barstate.islast only is the cheapest pattern of all: the work happens once on history and then on each live update. Setters can be called as functions (label.set_text(tag, "...")) or as methods (tag.set_text("...")); they do the same thing.
Getters read a drawing back: label.get_text, label.get_x, label.get_y, line.get_x1, line.get_y2, box.get_top and so on. line.get_price gives the price of a line at any bar index, which is how you test whether the price has crossed a trend line.
#Labels
label.new takes x, y and text, then the style arguments:
| Argument | What it does | Default |
|---|---|---|
style | The label's shape (see below) | label.style_label_down |
color | The bubble or shape color | blue |
textcolor | The text color | white |
size | size.tiny ... size.huge, or size.px(n) / size.pt(n) / size.rel(x) | size.normal |
textalign | text.align_left, text.align_center, text.align_right | center |
tooltip | Text shown in a card when the pointer hovers over the label (a click pins the card, a tap opens it on a phone): a plain text, or a tooltip card | none |
text_font_family | font.family_default or font.family_monospace | default |
text_formatting | text.format_bold, text.format_italic, or both added | none |
avoid | true: the chart may nudge the label up or down so it does not cover other labels (see below) | false |
avoid_group | A name: this script's avoid labels and markers with the same name move as one stack | none |
Label styles fall into three groups:
- Bubbles with a pointer at the point:
label.style_label_down(bubble above, pointing down),label.style_label_up,label.style_label_left,label.style_label_right,label.style_label_lower_left,label.style_label_lower_right,label.style_label_upper_left,label.style_label_upper_right, andlabel.style_label_center(no pointer). - Shapes drawn at the point:
label.style_circle,label.style_square,label.style_diamond,label.style_cross,label.style_xcross,label.style_flag,label.style_triangleup,label.style_triangledown,label.style_arrowup,label.style_arrowdown. - Text only:
label.style_none(plain text) andlabel.style_text_outline(text with an outline that stays readable over candles).
Text in labels is always plain text. \n starts a new line.
#Labels that keep clear of each other
Two scripts that label the same price cover each other's labels, and one script cannot see what another one drew. avoid: true leaves the tidying to the chart: when it draws, it nudges the label up or down, away from the other avoid labels, the avoid markers of plotshape and plotchar and the level tags of any script on the same pane. The order by price is kept, and a moved label gets a short leader back to its real price.
const ph = ta.pivothigh(high, 5, 5)
if (!na(ph)) {
    label.new(bar_index - 5, ph, "PH", { style: label.style_label_down, size: size.small, avoid: true, avoid_group: "pivots" })
}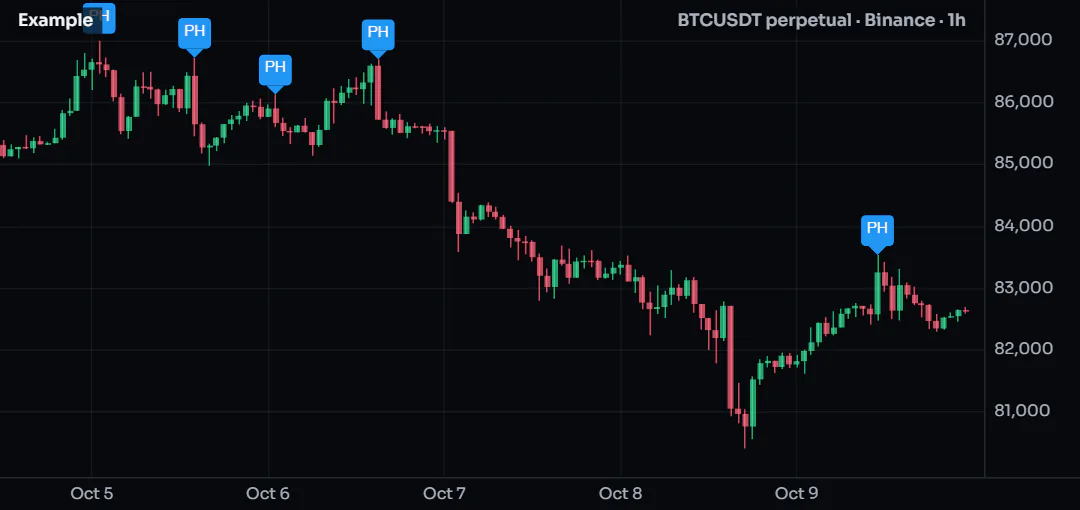
avoid_groupkeeps a script's labels with the same name together: they move as one stack.- Both are constants, set when the label is made. A label without
avoidis drawn exactly where it always was. - Only the picture changes. The script never learns where its label went:
label.get_ystill returns the price you gave, and values, alerts and runs on ChartDeck's servers are untouched.
To space your own labels in the logic, where the result must be the same on the chart and in an alert, use place.free_price. Linking scripts shows both together.
#Lines
line.new takes two points (x1, y1, x2, y2, or two chart points) and these style arguments:
| Argument | Values | Default |
|---|---|---|
extend | extend.none, extend.right, extend.left, extend.both | extend.none |
color | Any color | blue |
style | line.style_solid, line.style_dashed, line.style_dotted, line.style_arrow_right, line.style_arrow_left, line.style_arrow_both, or a dash pattern of your own with dash.custom | solid |
width | Pixels | 1 |
dash.custom(5, 3) draws 5 pixels, leaves 3 and repeats; give up to eight lengths for a dash-dot pattern (dash.custom(8, 2, 2, 2)). It works for a box's border_style and a polyline's line_style too, and it is how the official scripts draw exactly the dashes of ChartDeck's built-in indicators.
extend.right turns a segment into a ray that continues past its second point to the edge of the chart, which is what you want for trend lines and support levels. extend.both gives an infinite line.
#Boxes
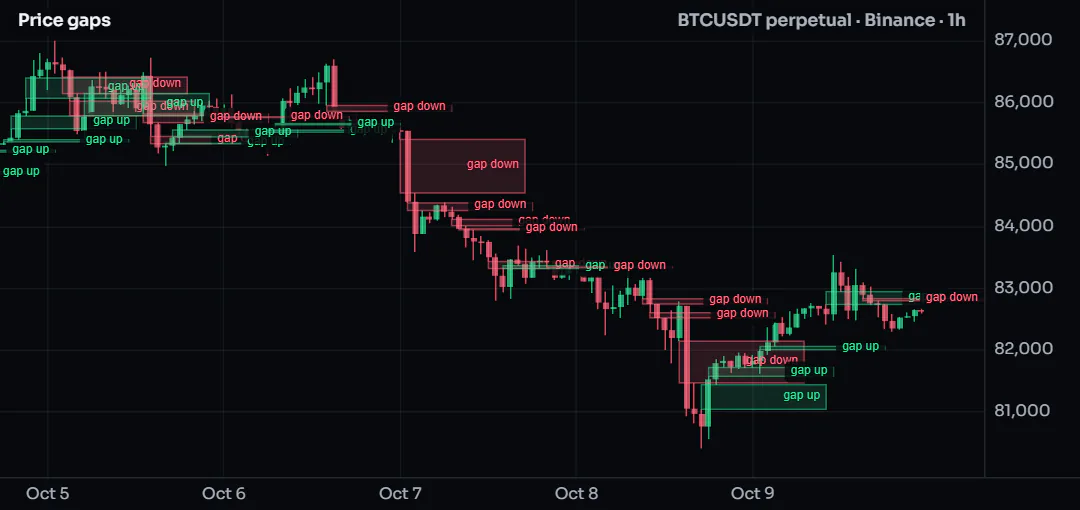
box.new takes left, top, right, bottom (or a top-left and a bottom-right chart point). This script boxes every three-bar price gap, where a bar's low is above the high two bars earlier (or the mirror for a gap down):
//@chartscript 1
indicator("Price gaps", { overlay: true, max_boxes_count: 150 })
const reach = input.int(15, "Box length (bars)", { minval: 1 })

if (low > high[2]) {
    box.new(
        bar_index - 2,
        low,
        bar_index + reach,
        high[2],
        {
            border_color: color.new(color.up, 50),
            bgcolor: color.new(color.up, 85),
            text: "gap up",
            text_color: color.up,
            text_size: size.tiny,
            text_halign: text.align_right
        }
    )
}
if (high < low[2]) {
    box.new(
        bar_index - 2,
        low[2],
        bar_index + reach,
        high,
        {
            border_color: color.new(color.down, 50),
            bgcolor: color.new(color.down, 85),
            text: "gap down",
            text_color: color.down,
            text_size: size.tiny,
            text_halign: text.align_right
        }
    )
}
| Argument | What it does |
|---|---|
border_color, border_width, border_style | The outline (line.style_* for the style) |
bgcolor | The fill color |
extend | extend.right / left / both stretches the box sideways to the chart edge |
text, text_color, text_size | Text inside the box |
text_halign, text_valign | text.align_left / center / right, text.align_top / center / bottom |
text_wrap | text.wrap_auto wraps long text to the box width; text.wrap_none does not |
Boxes are drawn blue with a blue fill unless you say otherwise, so set bgcolor (and usually make it very transparent).
#Polylines
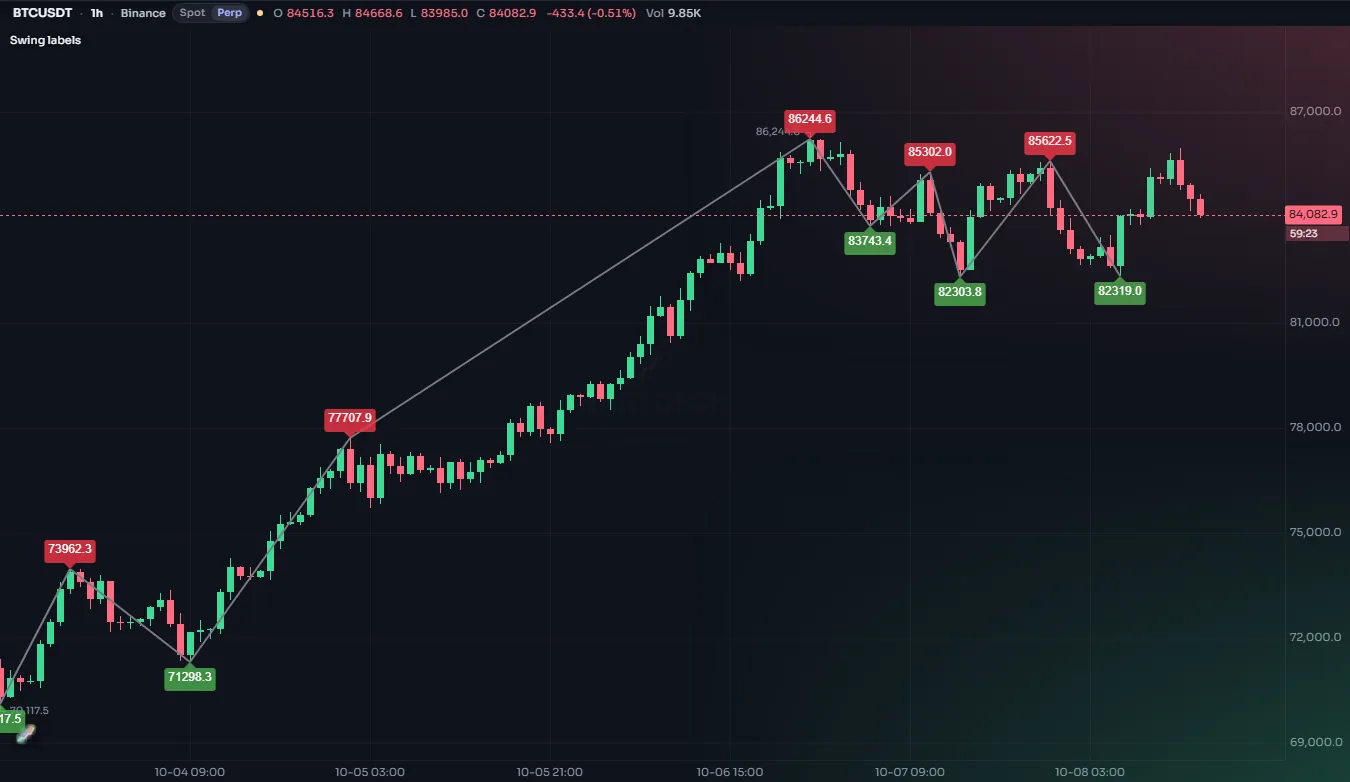
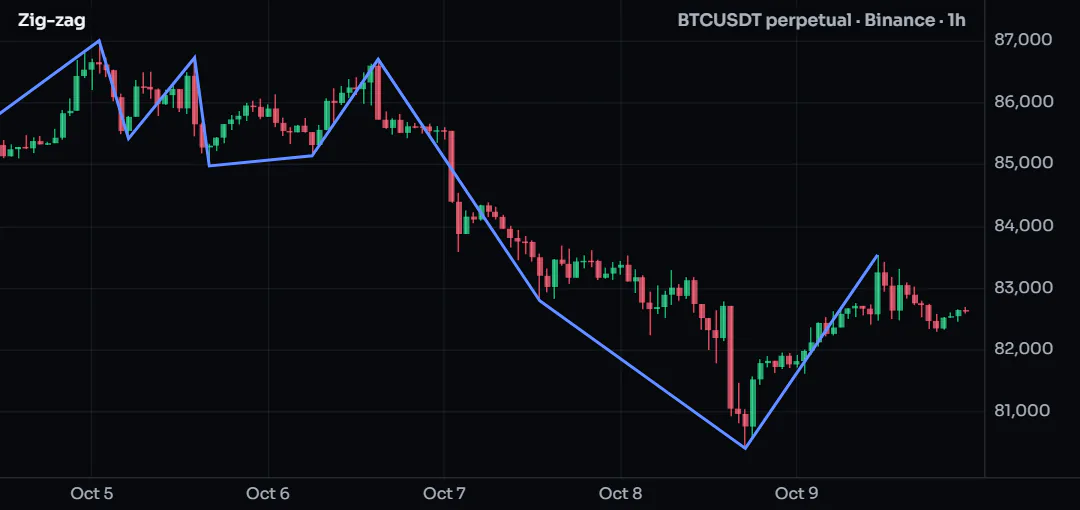
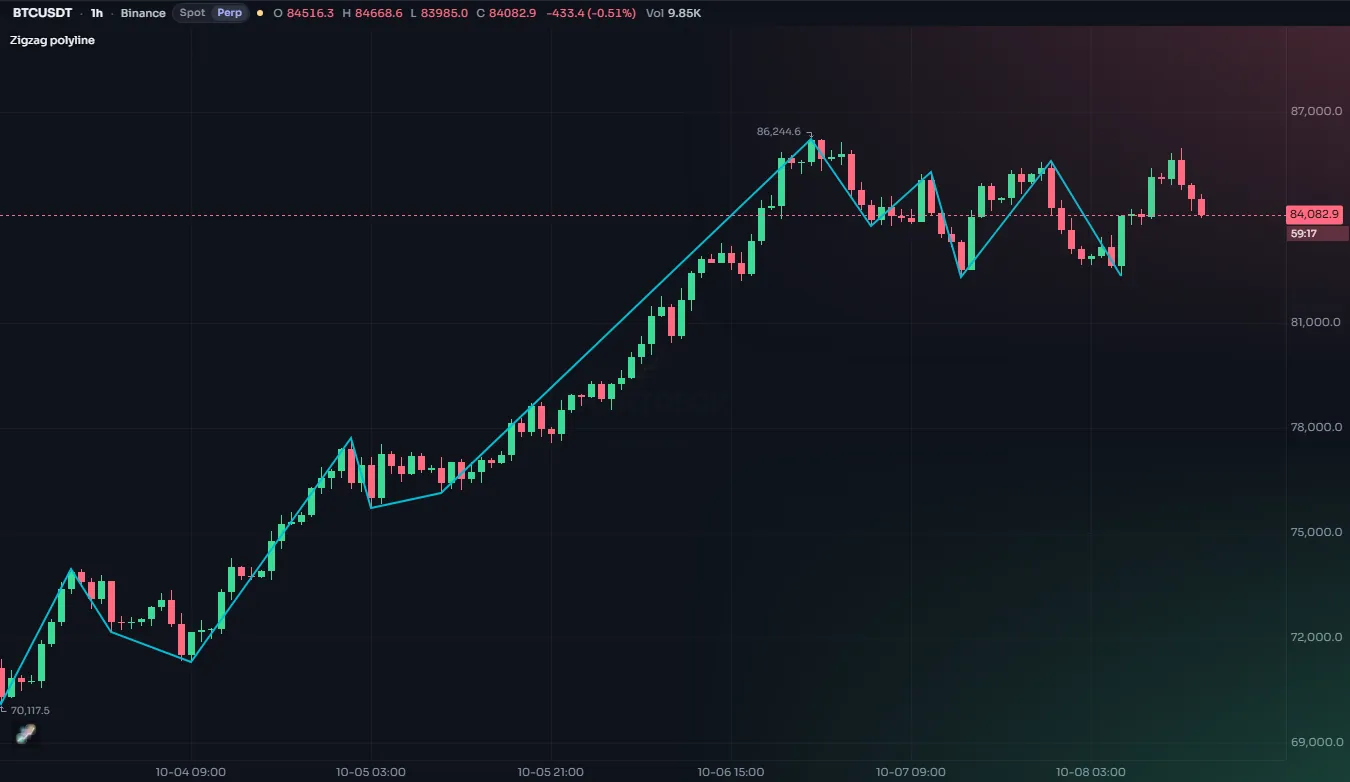
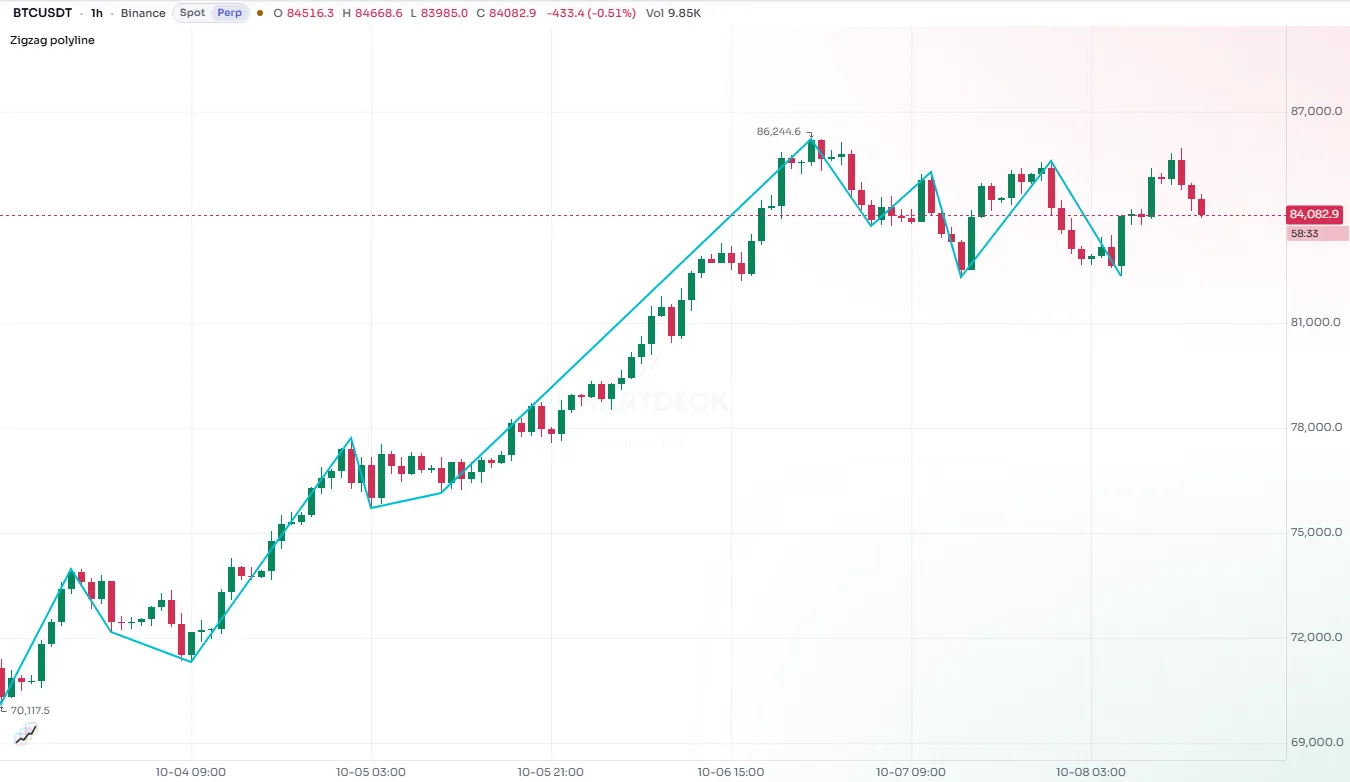
A polyline joins a whole array of chart points in one object, up to 10,000 points. It is the efficient way to draw a zig-zag, a projected path or any shape with many corners: one polyline replaces hundreds of lines.
//@chartscript 1
indicator("Zig-zag", { overlay: true })
const span = input.int(8, "Bars each side", { minval: 2 })
const ph = ta.pivothigh(high, span, span)
const pl = ta.pivotlow(low, span, span)

state points = array.new<chart.point>()
if (!na(ph)) {
    points.push(chart.point.from_index(bar_index - span, ph))
}
if (!na(pl)) {
    points.push(chart.point.from_index(bar_index - span, pl))
}
// keep the last 60 turns
if (points.size() > 60) {
    points.shift()
}

state path: polyline = na
if (barstate.islast) {
    polyline.delete(path)
    path = polyline.new(points, { line_color: color.accent, line_width: 2 })
}
| Argument | What it does | Default |
|---|---|---|
points | An array<chart.point> | required |
curved | Draw a smooth curve through the points instead of straight segments | false |
closed | Join the last point back to the first | false |
line_color, line_style, line_width | The line | blue, solid, 1 |
fill_color | Fill the shape (useful with closed: true) | none |
xloc | Whether the points' bar index or time is used | xloc.bar_index |
A polyline cannot be changed after it is made; to update it, delete it and make a new one, as above.
#Line fills
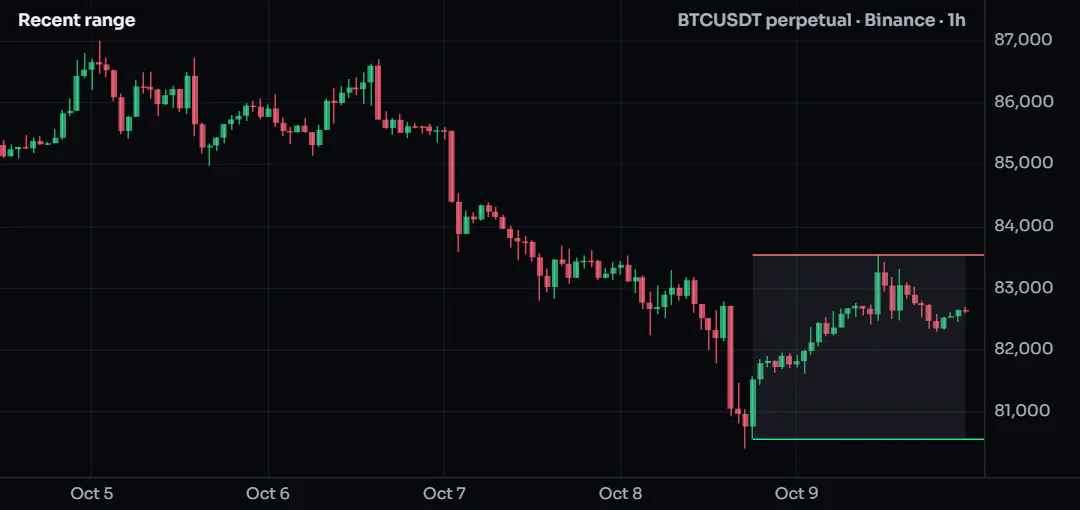
linefill.new fills the area between two existing lines. It follows the lines when they move, and it disappears when either line is deleted.
//@chartscript 1
indicator("Recent range", { overlay: true })
const len = input.int(30, "Bars", { minval: 2 })
state top: line = line.new(na, na, na, na, { color: color.down, extend: extend.right })
state bottom: line = line.new(na, na, na, na, { color: color.up, extend: extend.right })
state zone: linefill = linefill.new(top, bottom, color.new(color.muted, 88))

// ta.* calls belong outside the if, so they see every bar
const hi = ta.highest(high, len)
const lo = ta.lowest(low, len)
if (barstate.islast) {
    top.set_xy1(bar_index - len + 1, hi)
    top.set_xy2(bar_index, hi)
    bottom.set_xy1(bar_index - len + 1, lo)
    bottom.set_xy2(bar_index, lo)
}
#Level tags
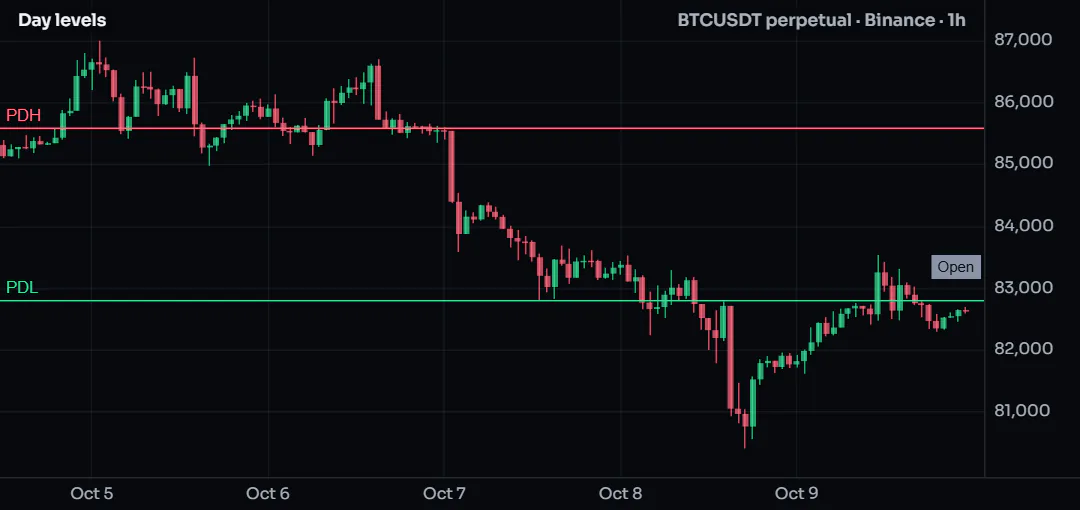
A script with many levels (yesterday's high and low, value areas, pivots, session opens) quickly fills the chart with lines and names. A level tag keeps it tidy: tag.new is a price, a name and a look. The chart draws it, keeps the names apart, joins levels at the same price into one name ("PDH + R1") and lets your members change the look of each level without a run.
//@chartscript 1
indicator("Day levels", { overlay: true })
const dayHigh = request.tf("1D", high[1], { at: request.close })
const dayLow = request.tf("1D", low[1], { at: request.close })
const dayOpen = request.tf("1D", open, { at: request.close })

state hi = tag.new(na, "PDH", { color: color.down, place: tag.place_chart, tooltip: "Previous day high", title: "Previous day high" })
state lo = tag.new(na, "PDL", { color: color.up, place: tag.place_chart, tooltip: "Previous day low", title: "Previous day low" })
state op = tag.new(na, "Open", { color: color.muted, place: tag.place_auto, title: "Day open" })

if (barstate.islast) {
    hi.set_y(dayHigh)
    lo.set_y(dayLow)
    op.set_y(dayOpen)
}
#The looks
place chooses one of five looks (or off). The script codes the default; a member can pick another one for each titled level.
| Look | Draws |
|---|---|
tag.place_chart | The line, with the name written on the chart beside the line's start, as the chart's own Pivots. No tag at the axis: the price is in the hover card (or in the label, see label_shows). |
tag.place_axis_line | The line, and one row at the right edge: the name in a small tag inside the pane against the price axis and the price in the same color on the axis |
tag.place_axis (the default) | The row at the axis, no line |
tag.place_auto_line | The row at the axis; the line only while the tag is among the nearest Auto tags above or below the live price |
tag.place_auto | The row at the axis, only while the tag is among the nearest Auto tags; no line |
tag.place_off | Nothing; the tag is kept, so set_place can show it again |
"Nearest" is tag.auto_keep(n) per side of the live price (2 by default, 0 to 6), for the whole script. The chart decides as the price moves, with no run.
At the axis, every name sits in one column and every price in the axis column. Rows that would overlap are nudged apart and keep their order by price; a pushed row gets a short leader back to its price.
#Options
| Option | Meaning | Default |
|---|---|---|
color | The fill of both tags and the line's color. The text is dark or white, whichever reads better. | The chart's accent |
textcolor | The text color of both tags | Dark or white by the fill |
show_price | false: the name tag only, no price on the axis | true |
line_from | The bar the line starts at (with xloc: xloc.bar_time, a time); na = the pane's left edge | na |
line_to | tag.line_to_tag: the line ends at the name tag; tag.line_to_bars: at the last bar (with no line_from, a short stub from the last bar to the tag) | tag.line_to_tag |
line_style, line_width, line_color | line.style_* or a dash.* pattern; 1 to 4 px; a line color different from the tags | solid, 1, color |
tooltip | The hover text: a plain text, or a tooltip card. The chart puts the name and the exact price first. | none |
title | A name for the settings: a titled tag gets its own rows on the Display, Style and Colors tabs | none |
size | the level's default text size: size.tiny, size.small, size.normal, size.large or size.huge (Extra-large); the member's Labels & text size wins over it | size.normal |
label_pos | Chart look: tag.label_left (the name at the line's start) or tag.label_right (at the right edge, the line stopping before it) | tag.label_left |
label_side | Chart look: tag.label_on (the name on the line) or tag.label_above (just above it) | tag.label_on |
label_shows | Chart look: tag.shows_name, tag.shows_price (the name and the price), tag.shows_dist (the name and the distance from the live price, in %) or tag.shows_all | tag.shows_name |
extend | Chart look: tag.extend_right (the line runs to the right edge), tag.extend_bar (to the last bar) or tag.extend_both (across the whole pane) | tag.extend_right |
sub | A sub-label: a second, smaller text by the name, 12 characters at most | "" (none) |
sub_pos | tag.sub_below, tag.sub_above or tag.sub_inline | tag.sub_below |
sub_color | The sub-label's color | na (see below) |
bg | The background at the axis: tag.bg_filled, tag.bg_price, tag.bg_name or tag.bg_none | tag.bg_filled |
Two calls set a default for the whole script: tag.fade_beyond(pct) draws the levels further than pct % from the live price faint (0 = off, the default), and tag.auto_edge(false) hides an Auto level that is off the screen instead of pinning it at the edge.
Change a tag later with set_y (or set_price; na hides it), set_text, set_color, set_textcolor, set_tooltip, set_place, set_show_price, set_line_from, set_line_to, set_line_style, set_line_width, set_line_color, set_label_pos, set_label_side, set_label_shows, set_extend, set_sub, set_sub_pos, set_sub_color, set_bg and set_size; read it with get_price, get_text, get_place, get_sub and get_bg; remove it with tag.delete. tag.all lists them.
#Sub-labels and backgrounds
A sub-label is a second, smaller text that belongs to the name: a hit rate, a period, an age.
sub_pos | Where the sub-label goes |
|---|---|
tag.sub_below (the default) | A small line under the name. The row is taller on that side only: the name stays at its price. |
tag.sub_above | A small line over the name |
tag.sub_inline | A subscript right after the name, inside the name tag (the tag is as wide as both) |
bg chooses what is a filled tag and what is plain text at the axis:
bg | Name | Price on the axis |
|---|---|---|
tag.bg_filled (the default) | Filled tag | Filled tag |
tag.bg_price | Text | Filled tag |
tag.bg_name | Filled tag | Text |
tag.bg_none | Text | Text |
Text with no tag behind it is written in the level's color over a thin outline in the chart's background color, so it stays readable over candles, grid lines and other lines. textcolor still sets the color of a text-only name and price. A color too close to the chart background is lightened or darkened until it reads.
The color of a sub-label, when sub_color is na: an inline sub-label inside a filled tag takes the tag's text color; a sub-label below or above the name, or beside a text-only name, takes the level's color. An inline sub_color that does not read on the filled tag (less than 4.5:1) falls back to the tag's text color.
//@chartscript 1
indicator("Levels with sub-labels", { overlay: true })
const pivot = request.tf("1W", (high[1] + low[1] + close[1]) / 3, { at: request.close })
const dayOpen = request.tf("1D", open, { at: request.close })

state pv = tag.new(na, "P", { sub: "W", sub_pos: tag.sub_inline, color: color.orange, title: "Weekly pivot" })
state op = tag.new(na, "Open", { sub: "0%", bg: tag.bg_none, color: color.cyan, title: "Day open" })

if (barstate.islast) {
    const move = (close - dayOpen) / dayOpen * 100
    pv.set_y(pivot)
    op.set_y(dayOpen)
    op.set_sub(str.tostring(move, "#.##") + "%")
    op.set_sub_color(move >= 0 ? color.up : color.down)
}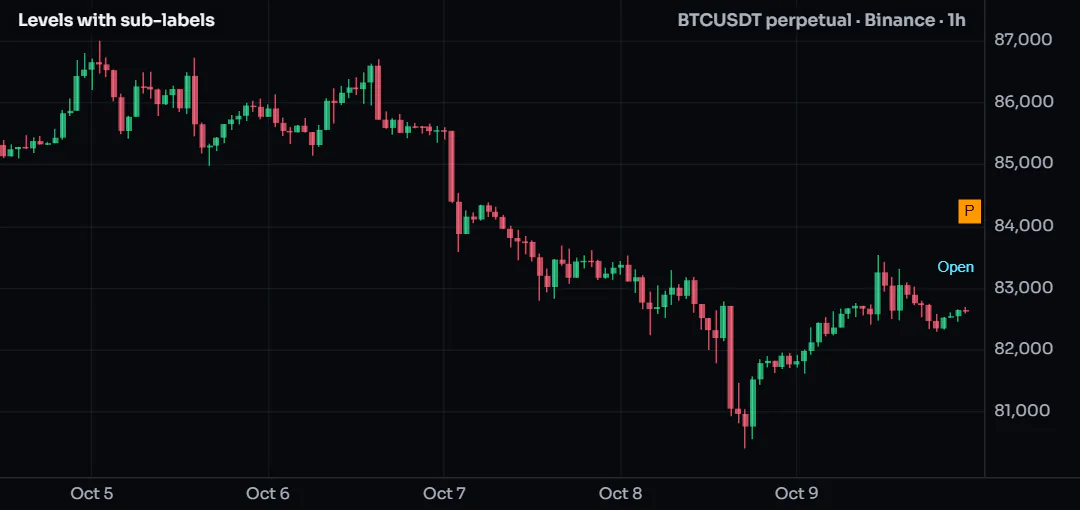
In the Chart look the sub-label sits under or over the name beside the line (or right after it, as a subscript); the chart places the taller label so that it covers no other label. Levels at the same price share one name, and their sub-labels are joined the same way ("22% + 71%"). When they ask for different backgrounds, the shared row is filled.
#Good to know
- Hover a name, a name tag or a price tag for its card: the name and the exact price, then your
tooltip(or the sub-label when there is no tooltip). The level's line is drawn (or thickened) while the pointer stays. A click on the tag pins the card. On a phone, a tap shows them for 3 seconds. - Right-click a level's name for Add alert at that level, at its exact price.
- Off the screen: a tag above or below the visible prices is pinned at that edge with an arrow, and the edge's hover lists it with its price. A tag never changes the price scale.
- Your members decide: the Display tab lists every titled level with its look (Chart, Axis with line, Axis, Auto with line, Auto). Under a level in the Chart look are its label (Left or Right, On the line or Above the line, what it shows) and how far its line runs. Under a level with a sub-label is Sub-label (As the script, Below, Above, Inline or Hide), and under a level at the axis is Background (As the script, Name and price, Price only, Name only or None). For the whole indicator there are Price on the axis, Fade levels further than, Auto: levels off the screen and Background (all levels). A level's line is on the Style tab and its color on the Colors tab; a color picked there also recolors a text-only level. All of these are a repaint, never a re-run, and "As the script" returns to what the script codes. The chart setting Indicator value labels hides the price tags together with the plots' value tags; names and lines stay.
- In a small pane the chart drops a sub-label before it would drop a level's row.
- Limits: a script keeps 64 tags (32 on Beginner); making one more removes the oldest. A sub-label does not count as a tag. A name is 24 characters at most and a sub-label 12 (a longer one is cut with "…").
- Tags are drawn on the chart only: they are not plots (no legend value, no data window entry, no alert source), and a request cannot make one.
#Deleting and listing
label.delete(id), line.delete(id), box.delete(id), polyline.delete(id) and linefill.delete(id) remove a drawing. Deleting na is allowed and does nothing, which keeps code like line.delete(trend) simple on the first pass.
label.all, line.all, box.all, polyline.all and linefill.all are arrays of every drawing of that kind the script still has, oldest first. They make a clean-up easy:
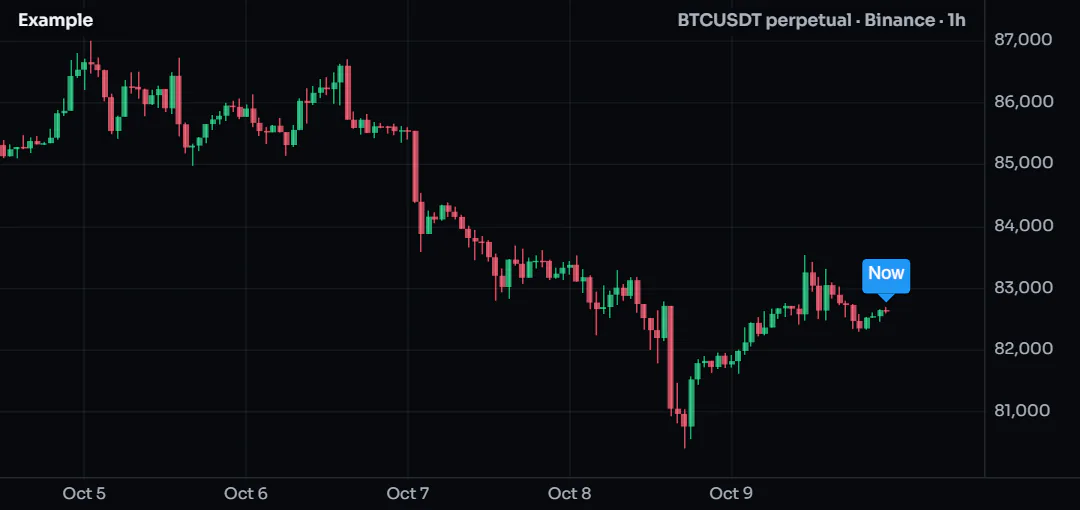
// start fresh on the last bar: remove every label made so far
if (barstate.islast) {
    for (const lb of label.all) {
        lb.delete()
    }
    label.new(bar_index, high, "Now", { yloc: yloc.abovebar })
}
copy (for example line.copy(id)) makes an independent duplicate you can then move.
#How many drawings a script keeps
Each kind has a budget. When the script creates one more than the budget allows, the oldest drawing of that kind is removed automatically. This is usually what you want: a script that labels every pivot shows the most recent ones.
| Kind | Default | Most you can ask for | Set with |
|---|---|---|---|
| Labels | 50 | 1,000 | indicator(..., { max_labels_count: N }) |
| Lines | 50 | 1,000 | max_lines_count: N |
| Boxes | 50 | 1,000 | max_boxes_count: N |
| Polylines | 50 | 500 | max_polylines_count: N |
| Line fills | 500 | ||
| Tables | 50 | see Tables | |
| Level tags | 64 (32 on Beginner) | see Level tags | |
Positions (drawing.position) | 50 | 500 | max_drawings_count: N |
Ask only for what you need. Every drawing costs memory and drawing time on every frame, and a chart with a thousand labels is hard to read anyway.
#Keeping drawings fast
- Create once, update after. Use
stateand setters for drawings that should exist once, as in Create once, then update. - Do the work on the last bar. Things that only matter now (a projection, a summary label, a zig-zag) can wait for
if (barstate.islast). - Use one polyline instead of many lines for any path with many corners.
- Let the budget work for you. You do not need to delete old drawings yourself; the oldest go first when the budget is full.
#Live bars
While a bar is still forming, the script runs again on every update. Anything an update does to drawings (creating, changing, deleting) is undone before the next update of the same bar, and only the run at the bar's close sticks. So a label.new on a live bar does not pile up one label per tick: you always see the result of the latest update. See the execution model for the full story.
#Named styles for drawings
The constructors accept look = with a style made by style.label, style.line or style.box. Every drawing that uses the same look can then be restyled by the user in one place, in the Style tab. The Style tab also has a switch that hides all of a script's labels, lines, boxes and tables at once. Their colors are also listed on the Colors tab, so the color presets reach them, and the size of their text follows the Labels & text tab, where a text style gets a row of its own. Drawings made without a look follow that tab too: its size switch (Tiny to Extra-large), font and dimming apply to every label, box and table of the script. The same size switch sizes the script's level tags, and under it each level title (the families the Display tab lists) can have a size of its own ("Same as whole script" by default). A level's size comes from that row first, then the whole-script size, then the size the script gave tag.new. So do not add inputs for the size of your level tags: ChartDeck's settings cover it. See the settings dialog.
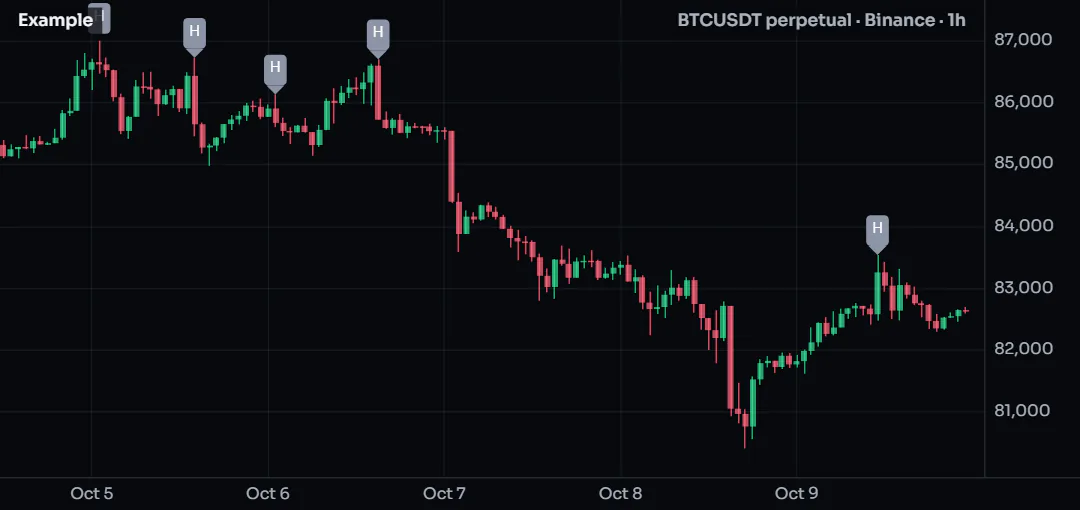
const swing = style.label("Swing labels", { color: color.muted })
const ph = ta.pivothigh(high, 5, 5)
if (!na(ph)) {
    label.new(bar_index - 5, ph, "H", { look: swing })
}