

Recipes: levels, tables and alerts
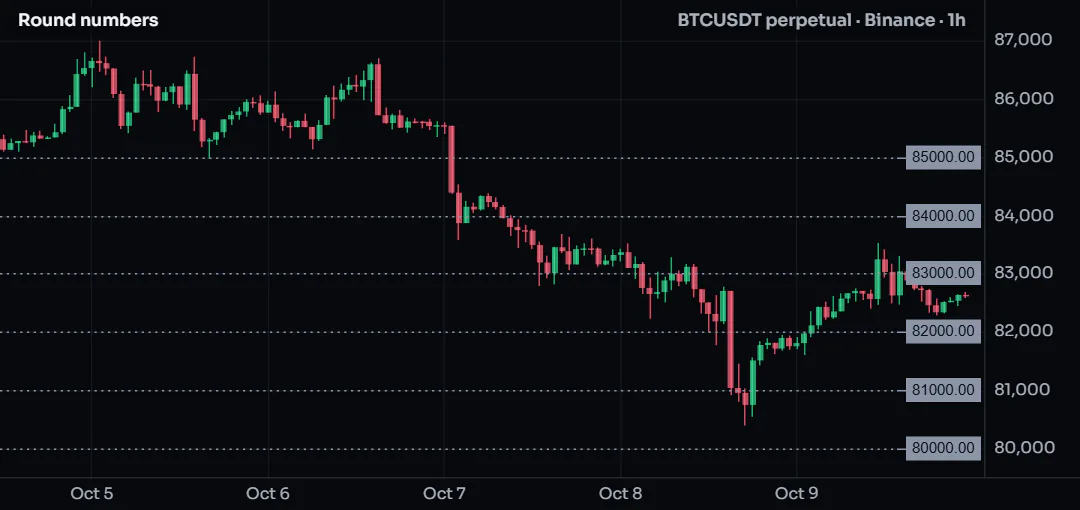
A heads-up table, prior-day levels and round numbers as level tags, and a script whose alerts carry their own numbers.
Not every script draws lines over price. Many of the most useful ones summarize: a small table in a corner, a few named levels at the price axis, an alert that tells you exactly what happened. These recipes cover the three.
| Recipe | What it does | What it teaches |
|---|---|---|
| Heads-up table | A corner table with the move, RSI, ATR, volume, taker share, open interest and funding, each colored | table.new, table.cell, barstate.islast, na handled as "-" |
| Prior-day levels as level tags | Yesterday's high, low and close and today's open as named tags at the price axis | request.tf, tag.new, tag.place_*, set_price |
| Round numbers near the price | The nearest round-number levels above and below, kept tidy by the chart | a pool of tags, tag.place_auto_line, tag.auto_keep |
| Alerts with their own numbers | Named alert conditions with placeholders, and an alert.send message built in code | alert.on, alert.send, {{plot("...")}}, frequencies |
#Heads-up table
One look at a corner of the chart answers the usual questions: how far has price moved, is it stretched, is volume unusual, who is aggressive, are positions growing. Values the market does not have (open interest on a spot market, taker volume on a venue whose candles lack it) show as "-".
Data: candles; flow.buy_share, oi.close, funding.rate where the market has them. Plan: every plan. Without the data: that row shows "-".
#The script
//@chartscript 1
indicator("Heads-up table", { overlay: true })
const len = input.int(24, "Change over (bars)", { minval: 1 })
const where = input.string("Top right", "Position", { options: ["Top right", "Bottom right", "Top left"] })

const pos = where == "Top right" ? position.top_right : where == "Bottom right" ? position.bottom_right : position.top_left
const move = (close - close[len]) / close[len] * 100
const rsi = ta.rsi(close, 14)
const atrPct = ta.atr(14) / close * 100
const volRatio = volume / ta.sma(volume, 20)
const buyShare = flow.buy_share * 100
const oiMove = (oi.close - oi.close[len]) / oi.close[len] * 100
const fundingApr = funding.rate * (24 / nz(funding.interval_hours, 8)) * 365

// "-" for a value the market does not have
function cellText(v, fmt) {
    return na(v) ? "-" : str.tostring(v, fmt)
}
function signColor(v) {
    return na(v) ? color.muted : v > 0 ? color.up : v < 0 ? color.down : color.text
}

state t: table = table.new(pos, 2, 7, { bgcolor: color.new(color.muted, 88), border_width: 1, border_color: color.grid })
if (barstate.islast) {
    const rows = array.from("Move " + str.tostring(len) + " bars", "RSI 14", "ATR, % of price", "Volume vs average", "Taker buys",
        "Open interest " + str.tostring(len) + " bars", "Funding, % a year")
    for (let i = 0; i < rows.size(); i++) {
        table.cell(t, 0, i, rows.get(i), { text_color: color.text, text_halign: text.align_left, text_size: size.small })
    }
    table.cell(t, 1, 0, cellText(move, "+#.##;-#.##") + "%", { text_color: signColor(move), text_size: size.small })
    table.cell(t, 1, 1, cellText(rsi, "#"), { text_color: rsi > 70 ? color.down : rsi < 30 ? color.up : color.text, text_size: size.small })
    table.cell(t, 1, 2, cellText(atrPct, "#.##") + "%", { text_color: color.text, text_size: size.small })
    table.cell(t, 1, 3, cellText(volRatio, "#.#") + "x", { text_color: volRatio > 2 ? color.amber : color.text, text_size: size.small })
    table.cell(t, 1, 4, cellText(buyShare, "#") + (na(buyShare) ? "" : "%"), { text_color: signColor(buyShare - 50), text_size: size.small })
    table.cell(t, 1, 5, cellText(oiMove, "+#.##;-#.##") + (na(oiMove) ? "" : "%"), { text_color: signColor(oiMove), text_size: size.small })
    table.cell(t, 1, 6, cellText(fundingApr, "+#.#;-#.#") + (na(fundingApr) ? "" : "%"), { text_color: signColor(fundingApr), text_size: size.small })
}
No picture: this example reads ChartDeck’s recorded market data (open interest, funding, liquidations, trade prints, footprints, the order book or volume at price), which the picture’s candles do not carry. Open it in the editor to see it on a live chart.
#How it works
- The table is created once (
state t) and filled only on the last bar: filling it on every historical bar would be wasted work. - Every value is an ordinary series, computed at the top level as usual; the table only displays the newest one.
- Two small functions keep the cells short:
cellTextwrites "-" forna,signColorcolors by sign. str.tostring(v, "+#.##;-#.##")writes a sign in front of positive and negative numbers alike.- The position is an option input mapped to a
position.*constant.
#Customize it
- Add a row: raise the row count in
table.new, add a label torowsand one moretable.cell. - Show the higher-timeframe trend:
request.tf("1D", close > ta.ema(close, 50))and a "Daily trend: up / down" cell. - Bigger text on a large screen:
size.normal.
#Run it
Any chart. On a spot market the open-interest and funding rows show "-"; on a venue whose candles carry no taker volume the taker row does. The dashboard table tutorial walks through tables in more depth.
#Concepts used
Tables, functions, strings and formatting, ChartDeck data.
#Prior-day levels as level tags
Yesterday's high, low and close, and today's open, are levels many traders watch. A level tag is the cleanest way to show them: the chart keeps the names apart, joins levels at the same price into one name, and lets members restyle each level without a run.
Data: candles of the same market on the daily timeframe. Plan: every plan.
#The script
//@chartscript 1
indicator("Prior-day levels", { overlay: true })
const look = input.string("On the chart", "Look", { options: ["On the chart", "At the price axis"] })
const place = look == "On the chart" ? tag.place_chart : tag.place_axis_line

// the last CLOSED daily bar: yesterday's high, low and close (no repainting)
const [pdh, pdl, pdc] = request.tf("1D", [high, low, close])
state dayOpen: float = na
if (timeframe.change("1D")) {
    dayOpen = open
}

state tHigh = tag.new(na, "PDH", { color: color.down, place: place, tooltip: "Previous day high", title: "Previous day high" })
state tLow = tag.new(na, "PDL", { color: color.up, place: place, tooltip: "Previous day low", title: "Previous day low" })
state tClose = tag.new(na, "PDC", { color: color.muted, place: place, tooltip: "Previous day close", title: "Previous day close" })
state tOpen = tag.new(na, "Open", { color: color.accent, place: place, label_shows: tag.shows_price, tooltip: "Today's open (UTC)", title: "Day open" })

if (barstate.islast) {
    tHigh.set_price(pdh)
    tLow.set_price(pdl)
    tClose.set_price(pdc)
    tOpen.set_price(dayOpen)
}
plot(pdh, "PDH (history)", color.new(color.down, 70), 1, plot.style_stepline, { display: display.data_window })
plot(pdl, "PDL (history)", color.new(color.up, 70), 1, plot.style_stepline, { display: display.data_window })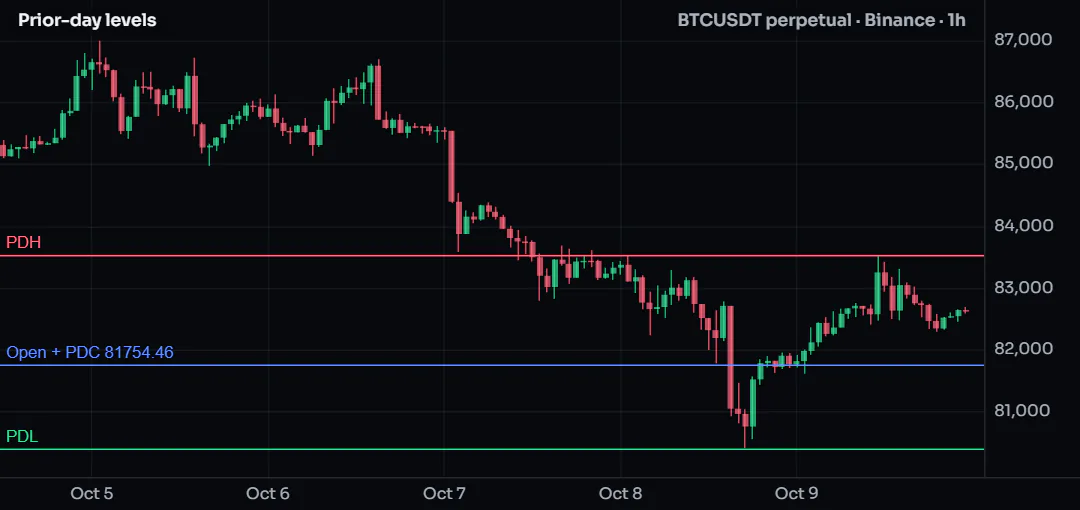
#How it works
request.tf("1D", [high, low, close])reads the last closed daily bar, which on today's bars is yesterday.- Each
tag.new(price, name, {...})is created once (state) withnaas its price, so nothing shows until the last bar sets it. placechooses the look:tag.place_chartwrites the name on the chart beside the line;tag.place_axis_lineputs a name tag and the price at the axis.set_priceon the last bar moves the tags; a tag withnais hidden.- The two hidden plots keep the levels' history in the Data Window, for checking past days.
#Customize it
- Weekly levels:
request.tf("1W", [high, low])and two more tags. - Show the distance from price:
label_shows: tag.shows_dist. - Fade levels far from price: call
tag.fade_beyond(3)once at the top.
#Run it
Any intraday chart. Days are UTC days. Members can restyle each level on the Display tab of the settings.
#Concepts used
Level tags, other timeframes, tag.new.
#Round numbers near the price
Round numbers (60,000, 65,000 and so on) collect orders. This script keeps a small pool of tags on the nearest round numbers above and below the price and lets the chart show only the closest ones, so the axis never fills up.
Data: candles only. Plan: every plan.
#The script
//@chartscript 1
indicator("Round numbers", { overlay: true })
const stepIn = input.float(0, "Step (0 = automatic)", { minval: 0 })
const each = input.int(3, "Levels on each side", { minval: 1, maxval: 6 })

// automatic step: a round power of ten about 1-2 % of the price, halved when that is too coarse
function autoStep(px) {
    const p = math.pow(10, math.floor(math.log10(px * 0.02)))
    return px * 0.02 / p >= 5 ? 5 * p : px * 0.02 / p >= 2 ? 2 * p : p
}

state pool = array.new<tag>()
if (barstate.isfirst) {
    tag.auto_keep(each)
    for (let i = 0; i < 2 * each; i++) {
        pool.push(tag.new(na, "", { color: color.muted, place: tag.place_auto_line, line_style: line.style_dotted }))
    }
}
if (barstate.islast) {
    const step = stepIn > 0 ? stepIn : autoStep(close)
    const base = math.floor(close / step) * step
    for (let i = 0; i < 2 * each; i++) {
        // base - (each - 1) steps up to base + each steps: `each` levels at or below the price, `each` above
        const px = base + (i - each + 1) * step
        const t = pool.get(i)
        t.set_price(px)
        t.set_text(str.tostring(px, format.mintick))
    }
}
#How it works
autoSteppicks 1, 2 or 5 times a power of ten close to 2 % of the price: 1,000 or 2,000 for BTC, a cent for a small coin.- A pool of tags is created once, on the first bar, and only moved afterwards: creating and deleting drawings on every update costs more.
tag.place_auto_lineshows a tag (and its line) only while it is among the nearest Auto tags on its side of the live price;tag.auto_keep(each)sets how many. The chart decides as price moves, with no run.
#Customize it
- A fixed step: set Step to 1000 for BTC.
- Name the big ones:
t.set_text(px % (step * 10) == 0 ? "Big round" : ...). - Always show all of them:
tag.place_axis_lineinstead oftag.place_auto_line.
#Run it
Any chart; the levels follow the price on each update.
#Concepts used
Level tags, collections, functions.
#Alerts with their own numbers
A good alert message says what happened and by how much, without opening the chart. This script declares named conditions for Create alert, fills their messages with placeholders, and also sends a message built in code with alert.send.
Data: candles only. Plan: every plan; the number of alerts you can keep depends on your plan (Alerts).
#The script
//@chartscript 1
indicator("EMA cross alerts", { overlay: true })
const fastLen = input.int(12, "Fast EMA", { minval: 2 })
const slowLen = input.int(26, "Slow EMA", { minval: 3 })

const fast = ta.ema(close, fastLen)
const slow = ta.ema(close, slowLen)
const rsi = ta.rsi(close, 14)
const crossUp = ta.crossover(fast, slow)
const crossDown = ta.crossunder(fast, slow)

plot(fast, "Fast EMA", color.accent, 2)
plot(slow, "Slow EMA", color.orange, 2)
plot(rsi, "RSI", color.muted, { display: display.data_window })
plotshape(crossUp, "Cross up", shape.triangleup, location.belowbar, color.up, { size: size.small })
plotshape(crossDown, "Cross down", shape.triangledown, location.abovebar, color.down, { size: size.small })

// named conditions: chosen in Create alert; placeholders filled when the alert fires
alert.on(crossUp, "Cross up", "{{ticker}} {{interval}}: fast EMA crossed above the slow one at {{close}} (RSI {{plot(\"RSI\")}})")
alert.on(crossDown, "Cross down", "{{ticker}} {{interval}}: fast EMA crossed below the slow one at {{close}} (RSI {{plot(\"RSI\")}})")

// a message built in code: one per closed bar at most
if (crossUp || crossDown) {
    const gapPct = (fast - slow) / slow * 100
    alert.send((crossUp ? "Bullish" : "Bearish") + " EMA cross, gap " + str.tostring(gapPct, "#.###") + "%, RSI " + str.tostring(rsi, "#"),
        alert.freq_once_per_bar_close)
}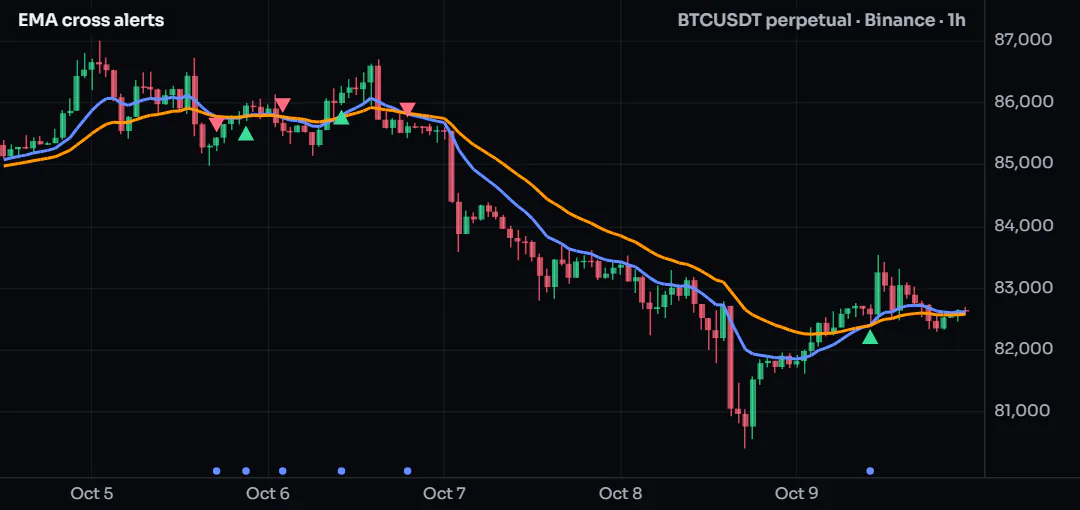
Alerts it sent Binance BTCUSDT perpetual · 1h · real output of the ChartDeck engine
Oct 2, 20:00 alert Bearish EMA cross, gap -0.062%, RSI 40
Oct 4, 06:00 alert Bullish EMA cross, gap 0.018%, RSI 60
Oct 5, 17:00 alert Bearish EMA cross, gap -0.006%, RSI 44
Oct 5, 21:00 alert Bullish EMA cross, gap 0.007%, RSI 53
Oct 6, 02:00 alert Bearish EMA cross, gap -0.016%, RSI 45
Oct 6, 10:00 alert Bullish EMA cross, gap 0.033%, RSI 58
Oct 6, 19:00 alert Bearish EMA cross, gap -0.01%, RSI 46
Oct 9, 10:00 alert Bullish EMA cross, gap 0.01%, RSI 54#How it works
alert.on(condition, title, message)is a named condition. It sends nothing on its own: once the script is on a chart, the conditions are listed in Create alert.- Placeholders such as
{{ticker}},{{close}}and{{plot("RSI")}}are filled at the moment the alert fires; the plot placeholder reads a plot by its title, even one shown only in the Data Window. alert.send(message, freq)sends a message built in code. In Create alert choose "Any alert.send() call"; the text arrives as{{message}}.alert.freq_once_per_bar_closesends it when the bar closes, at most once.alert.onmust be written at the top level; combine conditions with&&rather than wrapping it in anif.
#Customize it
- Add a filter:
alert.on(crossUp && rsi < 60, "Cross up, not overbought", ...). - Every update instead of the close:
alert.freq_all(the message may then fire on a cross that later undoes itself). - Add a sound on the chart with
sound.play(see Alerts).
#Run it
Add the script, then Create alert on its legend row. Script alerts run on ChartDeck's servers, so they fire with the chart closed.
#Concepts used
Alerts, message placeholders, repainting.
#Marks on the levels you drew
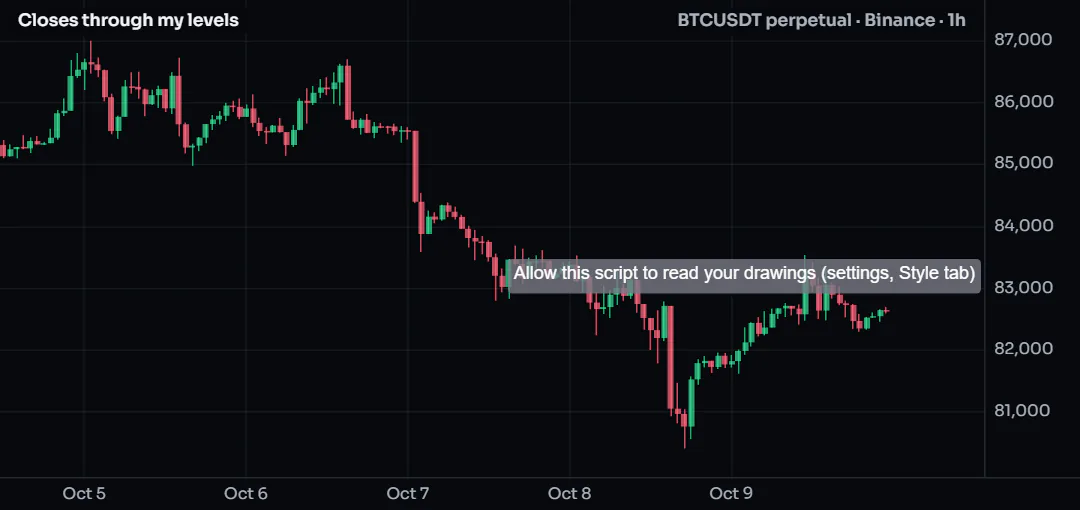
You draw your own levels with the horizontal line tool. This script reads them, with your permission, and marks the bars that close through one, without a level being typed into the script.
Data: candles and your own drawings on the chart. Plan: every plan. Turn on Allow this script to read my drawings on this chart in the script's settings (Style tab); until then it reads nothing and says so.
#The script
//@chartscript 1
indicator("Closes through my levels", { overlay: true })

let crossedUp = false
let crossedDown = false
for (const d of drawing.user("hline")) {
    if (close > d.price && close[1] <= d.price) {
        crossedUp = true
    }
    if (close < d.price && close[1] >= d.price) {
        crossedDown = true
    }
}
plotshape(crossedUp, "Up through my level", shape.triangleup, location.belowbar, color.green)
plotshape(crossedDown, "Down through my level", shape.triangledown, location.abovebar, color.red)
if (barstate.islast && !drawing.user_allowed) {
    label.new(bar_index, high, "Allow this script to read your drawings (settings, Style tab)", { yloc: yloc.abovebar, color: color.new(color.gray, 20) })
}
#How it works
drawing.user("hline")returns your horizontal lines and rays on this chart, read-only, once you allowed it; an empty list before.- Each bar compares the close with every level. When you move or add a line, the script runs again after a short pause.
drawing.user_allowedtells the script whether you allowed it, so it can show a hint instead of staying silent.
#Customize it
- Trend lines instead:
drawing.user("trend")and the line's price at a bar fromprice,index,price2andindex2. - Only your positions' stops:
drawing.user("position")andd.stop.
#Run it
Draw one or two horizontal lines and allow the script in its settings. The marks are drawn in your browser. Script alerts run on ChartDeck's servers, which never see your drawings (see Positions and your drawings), so for an alert on a level, give the level to a script as an input.