
Tooltips and tooltip cards
Every script tooltip opens in a card that scrolls, pins and opens on a tap. Write structured cards with pages, checks and small charts using tip.
A label, a table cell, a level tag and a position can each carry a tooltip: a text the chart shows when the reader points at the object. The tooltip is always a string. This page covers two things:
- what the chart does with every tooltip, with no change to your script, and
- how to write a tooltip card: a title, badges, rows of label and value, a checklist, pages, and small pictures the chart draws from your numbers. You build it with the
tipfunctions.
#What every tooltip gets
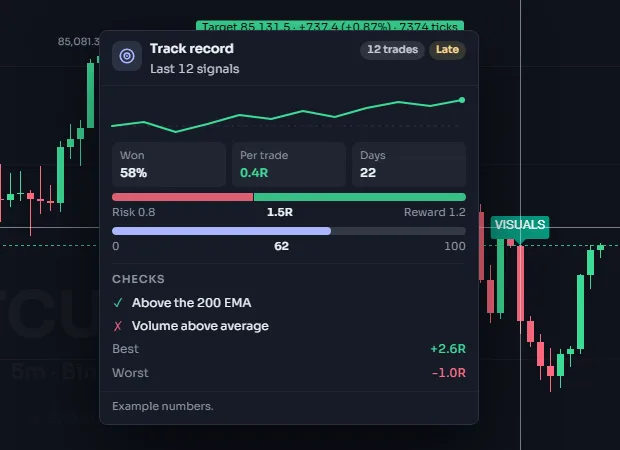
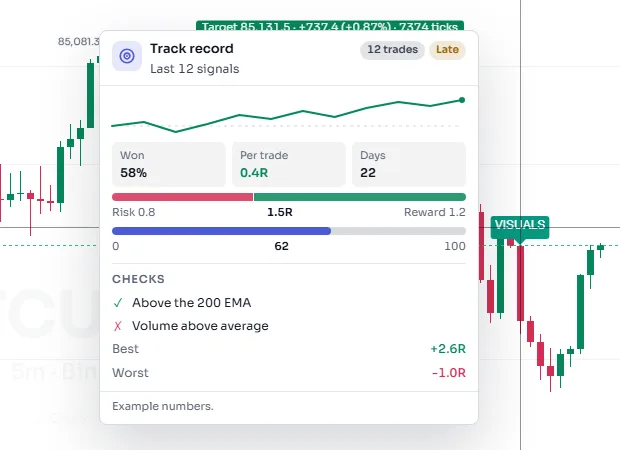
A tooltip that is plain text keeps its exact characters and line breaks. The card around it does the rest:
| Beside the object | The card opens next to the label, on the side with more room, inside the pane. It does not sit on the label, on the label's bar or under the price axis. |
| A height limit | The card is at most 60 % of the pane high (420 px at most). A longer text scrolls inside the card. |
| You can reach it | Move the pointer from the label onto the card: it stays open. The mouse wheel on the card scrolls its text and does not zoom the chart. |
| Click to pin | Click the label (or the card). The card stays open wherever the pointer goes, so the text can be read, scrolled and selected. Escape, the card's close button, a click elsewhere on the chart, or moving the chart closes it. |
| Tap on a phone | A tap on the label opens the tooltip. On a narrow chart it opens as a sheet along the bottom of the chart; a tap elsewhere closes it. |
| Keyboard | With a card open, Tab moves into it and Escape closes it. |
| One at a time | A chart shows one card at a time, across all its scripts: a label's tooltip, a level tag's card or a position's card. |
A plain tooltip holds 2,000 characters. Nothing else changes for scripts written before tooltip cards existed.
#A tooltip card
A card starts with tip.card. Every other tip function returns one part; join the parts with + and pass the result as the tooltip.
//@chartscript 1
indicator("Tooltip card", { overlay: true })
const fast = ta.ema(close, 9)
const slow = ta.ema(close, 21)
const atr = ta.atr(14)
const trend = ta.ema(close, 200)
const volAvg = ta.sma(volume, 20)

if (ta.crossover(fast, slow) && barstate.isconfirmed) {
    const stop = close - 1.5 * atr
    const target = close + 3 * atr
    let t = tip.card("EMA cross up", { sub: "The 9 EMA closed above the 21 EMA" })
    t += tip.badge("2.0R", tip.up)
    t += tip.row("Entry", str.tostring(close, format.mintick))
    t += tip.row("Stop", str.tostring(stop, format.mintick), tip.down)
    t += tip.row("Target", str.tostring(target, format.mintick), tip.up)
    t += tip.section("Checks")
    t += tip.check("Close above the 200 EMA", close > trend)
    t += tip.check("Volume above its average", volume > volAvg)
    t += tip.footer("An example, not advice.")
    label.new(bar_index, low, "Cross", { style: label.style_label_up, color: color.up, textcolor: color.white, tooltip: t })
}
plot(fast, "Fast", color.aqua)
plot(slow, "Slow", color.orange)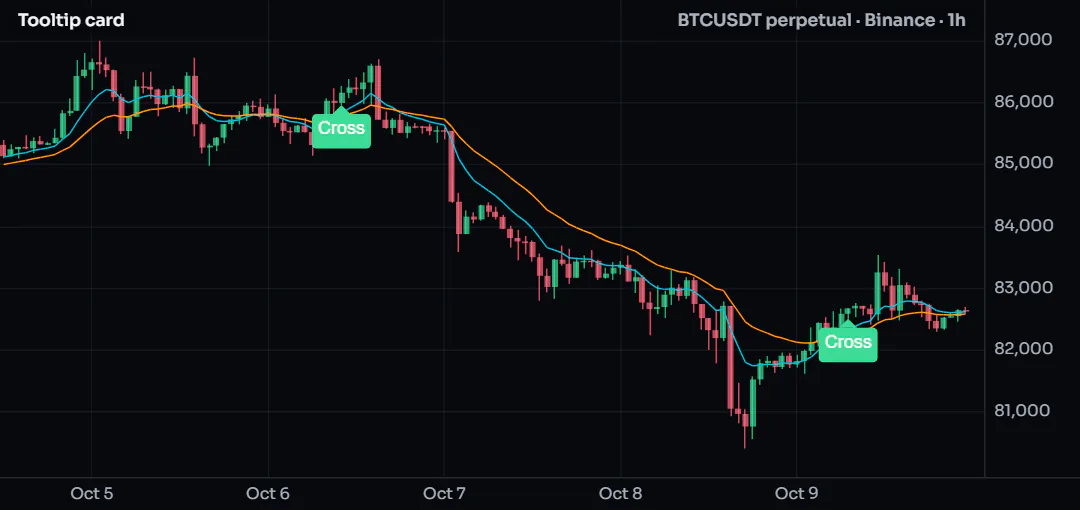
Hover a Cross label to open its card. The chart draws the card in its own look, in the dark and the light theme. Numbers line up in a column, and a tone (tip.up, tip.down, tip.warn, tip.muted, tip.accent) takes the theme's color for it.
#The parts
| Function | What it adds |
|---|---|
tip.card(title, { sub, rotate }) | Starts the card: the title (two lines at most), an optional subtitle, and rotate for cards with pages. |
tip.badge(text, tone) | A small pill beside the title. 4 at most. |
tip.icon(name, tone) | A built-in icon beside the title. |
tip.text(text) | A paragraph. Line breaks in the text are kept. |
tip.bullet(text) | A bullet point. |
tip.check(text, state) | A checklist line: true passed, false failed. Leave state out for a neutral line (shown, not counted). |
tip.row(label, value, tone) | A muted label on the left, the value right-aligned. |
tip.section(title) | A small uppercase heading. |
tip.divider() | A thin line. |
tip.note(text) | A muted note. |
tip.footer(text) | The footer: one per card, fixed at the bottom while the body scrolls. |
tip.page(title) | Starts a page; its title is a tab. |
tip.rotate(ms) | Lets the pages change by themselves (the same as rotate in tip.card). |
tip.rr(risk, reward) | A reward-to-risk bar from two positive numbers. |
tip.bar(value, min, max, tone) | A progress bar. |
tip.spark(values, tone) | A mini line of the last 60 numbers of an array. |
tip.stat(value, label, tone) | One cell of a stat grid: a value over a small label. |
Text arguments are texts: format a number first with str.tostring. Only tip.rr, tip.bar and tip.spark take numbers, because the chart draws them.
#Pages
A long tooltip reads better as pages. Everything after tip.page("Name") belongs to that page, up to the next tip.page. The page names are tabs at the top of the card (dots on a card narrower than 300 px). The reader changes pages with the tabs, the left and right arrow keys, the mouse wheel, or a swipe on a phone. The card keeps one size, that of its tallest page, so it does not jump under the pointer.
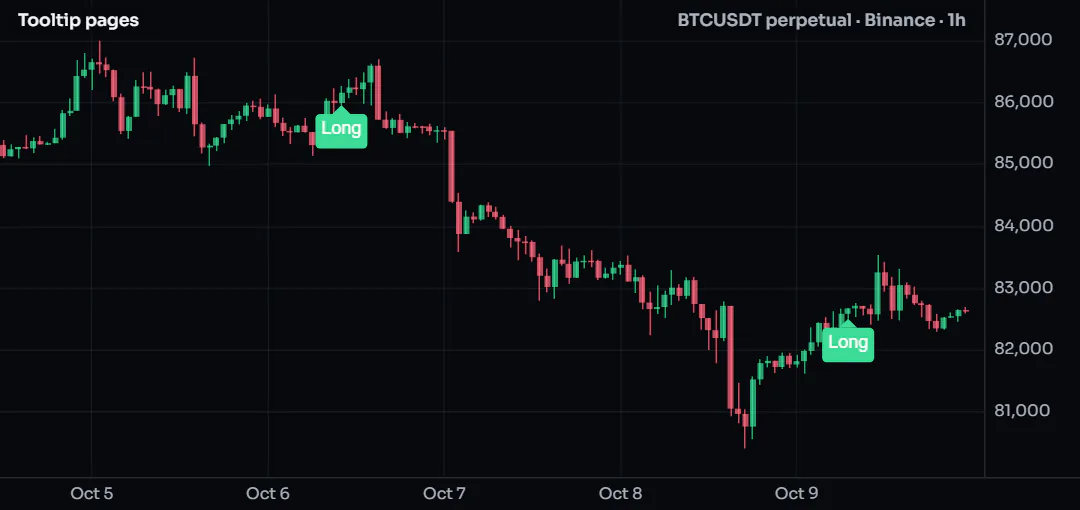
With rotate the pages also change by themselves. This script reproduces a long signal tooltip as four pages that change every four seconds:
//@chartscript 1
indicator("Tooltip pages", { overlay: true })
const atr = ta.atr(14)
const trend = ta.ema(close, 200)
const volAvg = ta.sma(volume, 20)
const up = ta.crossover(ta.ema(close, 9), ta.ema(close, 21)) && barstate.isconfirmed
state results: array<float> = array.new_float()

if (up) {
    const stop = close - 1.5 * atr
    const target = close + 3 * atr
    // the running result of the earlier signals, in R (example numbers)
    results.push(results.size() == 0 ? 0.0 : results.last() + (close > close[10] ? 1.0 : -0.5))
    let t = tip.card("Long setup at " + str.tostring(close, format.mintick), { sub: "Zone held twice", rotate: 4000 })
    t += tip.icon("target") + tip.badge("2.0R", tip.up)

    t += tip.page("Signal")
    t += tip.text("The 9 EMA closed above the 21 EMA after the zone was tested twice.")
    t += tip.row("Entry", str.tostring(close, format.mintick))
    t += tip.row("Volume", str.tostring(volume / volAvg, "#.#") + "x average")

    t += tip.page("Checks")
    t += tip.check("Close above the 200 EMA", close > trend)
    t += tip.check("Volume above its average", volume > volAvg)
    t += tip.check("Open interest: not read by this script")
    t += tip.note("A neutral line is shown, not counted.")

    t += tip.page("Risk")
    t += tip.rr(close - stop, target - close)
    t += tip.row("Stop", str.tostring(stop, format.mintick), tip.down)
    t += tip.row("Target", str.tostring(target, format.mintick), tip.up)

    t += tip.page("Track record")
    t += tip.spark(results, tip.accent)
    t += tip.stat(str.tostring(results.size()), "Signals")
    t += tip.stat(str.tostring(results.last(), "#.#") + "R", "Running result", results.last() >= 0 ? tip.up : tip.down)
    t += tip.stat("1h", "Timeframe")
    t += tip.footer("Example numbers, not a tested result.")
    label.new(bar_index, low, "Long", { style: label.style_label_up, color: color.up, textcolor: color.white, tooltip: t })
}
Rotation is built for reading, so it is careful:
- It is off unless the script sets
rotate(or callstip.rotate). The time per page is 2,500 ms at least and 20,000 ms at most. - It runs only while the pointer rests on the label. The thin line at the top of the card shows the time left.
- It stops while the pointer is on the card, while the card is pinned, while text is selected and while the browser tab is hidden.
- After the reader changes the page by hand it does not start again.
- A reader who asked the system for reduced motion never gets it. A card opened by a tap does not rotate either.
#Pictures the chart draws
There are no image files in a tooltip. A script passes numbers and names, and ChartDeck draws the picture, so it follows the theme, stays sharp and loads nothing:
tip.rr(risk, reward): a bar split by the two distances, with the ratio in the middle.tip.bar(value, min, max, tone): a bar filled frommintovalue.tip.spark(values, tone): a mini line. Pass an array; keep the last values of a series in astatearray, as the script above does withresults.tip.stat(value, label, tone): cells written one after another form one grid, three to a row (two on a narrow card).tip.icon(name, tone): one of the built-in icons:target,stop,flag,bolt,clock,warning,check,cross,up,down,flat,volume,liquidity,news,calendar,star,info,shield,rocket,fire,eye,lock,chart,coin. Another name draws nothing.
#Where a card shows
| Object | The card |
|---|---|
| A label, a table cell | The whole card on hover, click to pin, tap on a phone. |
A level tag (tag.new) | The level's name and exact price first, then the card. |
A position (drawing.position) | The position's small card shows the card's title and subtitle. Details opens the whole card there, with Edit this trade kept under it. |
| A table docked under the chart, a legend item | Text only: the card's readable text. |
| A script alert | The label's text. An alert that reads a label's tooltip gets its readable text (200 characters). |
#The markup behind it
tip.card and the other functions only write text. A card is a string whose first line is exactly ::card (or ::card rotate=4000); the next line is the title, and every line after that is one part. You can read it with label.get_tooltip, build it yourself, or keep it in a variable like any other string.
::card rotate=4000
Long setup at 101.20
> Zone held twice
!icon target
[up] 2.0R
=== Signal
The 9 EMA closed above the 21 EMA.
Entry :: 101.20
Stop :: 100.40 {down}
=== Checks
+ Close above the 200 EMA
x Volume above its average
. Open interest: not read
# A section
- A bullet
~ A muted note
---
=== Risk
!rr 0.8 1.6
!bar 62 0 100 accent
!spark 0,0.4,-0.6,0.2,1.1 up
!stat 58% | Won
^ The footer| Line | Part |
|---|---|
> text | The subtitle. |
[tone] text or [] text | A badge. |
# text | A section heading. |
--- | A divider. |
- text | A bullet. |
+ text, x text, . text | A check: passed, failed, neutral. |
label :: value | A row. End it with {up}, {down}, {warn}, {muted} or {accent} for a tone. |
**bold** | Bold, inside any text. |
~ text | A muted note. |
^ text | The footer. |
=== title | A new page. |
!rr, !bar, !spark, !stat, !icon, !rotate | The visuals, the icon and the rotation, as the functions write them. |
| anything else | A line of text. |
A line the chart does not understand, such as an unknown ! line, is shown as text. It is never an error and it is never dropped.
#Text from outside is safe
The tip functions escape the texts you give them, so a text can never turn into markup by accident: a symbol name, an input a member typed, a value read from another script. tip.text("- not a bullet") shows - not a bullet. The rule, if you write the markup by hand: a backslash makes the next character literal (\*, \{, \:), and a line that starts with a backslash has no marker.
A tooltip that does not start with tip.card is plain text. If you see ::card or !rr on the chart, the tooltip has something in front of the card; start the string with tip.card.
#Limits
| Limit | |
|---|---|
| A plain tooltip | 2,000 characters |
| A card (the whole string) | 4,000 characters |
| Pages | 6, each title 24 characters |
| Parts on a page | 24 |
| Title, subtitle | 80 characters each; the title shows on two lines at most |
| Badges | 4, each 20 characters |
| A row | label 40 characters, value 60 |
| A line of text | 400 characters |
| Stat cells on a page | 9 |
| Mini lines in a card | 2, each 60 points |
Bars on a page (tip.rr and tip.bar together) | 4 |
rotate | 2,500 to 20,000 ms |
| Card width | 240 px for a few short lines, 320 px, 380 px with a stat grid or a mini line; never wider than the pane |
| Card height | 60 % of the pane, 420 px at most; the body scrolls |
Where a card holds more than a limit allows, the rest is left out and one muted line, … more, says so.
#What a tooltip cannot hold, and why
Scripts are shared in the Community, so a tooltip is shown to members who did not write it. For that reason a tooltip holds no images from the internet, no links, no uploads, no GIFs or video, and no HTML, colors or styles of its own:
- A picture loaded from another site would tell that site who is looking at which chart, and could show anything inside ChartDeck.
- HTML or a link from a script could imitate ChartDeck's own buttons or lead a member away.
The card's parts, tones and the built-in icons cover the same ground safely: the script says what to show, and the chart decides how it looks.