

Recipes: order flow
Five scripts on who is buying and selling - delta spikes, big prints, CVD divergence, absorption and stacked-imbalance zones from footprints.
Order flow is about the aggressor: the trader who crossed the spread. A taker buy lifts the offer, a taker sell hits the bid. ChartDeck gives a script that flow at several levels of detail: per bar (flow.delta), per trade (flow.prints) and per price row inside the bar (fp.*, the footprint). The recipes go from the simplest to the most detailed.
| Recipe | What it does | What it teaches |
|---|---|---|
| Delta spikes | Columns of taker buy minus taker sell volume, with unusual bars marked | flow.delta, nz, relative thresholds |
| Big prints on the chart | A dot for every trade above an automatic size, and the big-print delta | flow.prints, flow.print_threshold, for...of, labels |
| CVD divergence | Marks where price makes a higher high or lower low that cumulative delta does not confirm | flow.cvd, pivots, ta.valuewhen, an option input |
| Absorption from footprints | Bars where the hardest selling sat at the low and price still closed high (and the mirror) | fp.* per-bar values, fp.available |
| Stacked-imbalance zones | Footprint stacks drawn as zones that stay until price trades back through them | fp.stacks, a user type, arrays of boxes |
The data behind each recipe, and what happens without it:
| Data | Where it exists | Plan | Without it |
|---|---|---|---|
flow.delta | candles that carry taker volume: Binance and Aster candles, tick and range bars | every plan | na: the columns are empty |
flow.cvd | the coin's Binance perpetual, on any chart | every plan (your plan's order-flow window) | na; the recipe can fall back to the chart's own delta |
flow.prints | the chart's market, from ChartDeck's recording and the live tape | every plan (15 minutes to 24 hours back by plan) | empty arrays on older bars |
fp.* | the chart's market and exchange, 1-minute to 1-day bars (and weekly / monthly) | Pro, Elite | na and empty arrays; the legend says "not included in your plan" |
#Delta spikes
Delta is taker buy volume minus taker sell volume. A bar whose delta is several times its usual size shows one side pressing hard: a burst of market buys into a breakout, or a wave of selling.
Data: flow.delta from the candles' taker volume. Plan: every plan. Without the data: on a venue whose candles carry no taker volume the series is na and the pane stays empty.
#The script
//@chartscript 1
indicator("Delta spikes", { format: format.volume })
const len = input.int(48, "Average over (bars)", { minval: 5 })
const mult = input.float(3.0, "Spike = this many times the average size", { minval: 1, step: 0.5 })

const d = flow.delta
// the usual SIZE of delta, whatever its sign
const usual = ta.sma(math.abs(nz(d)), len)
const spike = !na(d) && usual > 0 && math.abs(d) > mult * usual

plot(d, "Delta", spike ? (d > 0 ? color.up : color.down) : color.new(d > 0 ? color.up : color.down, 70), { style: plot.style_columns })
plot(usual * mult, "Spike level", color.muted, 1, plot.style_stepline)
plot(-usual * mult, "Spike level (sells)", color.muted, 1, plot.style_stepline)
hline(0, "Zero", color.new(color.muted, 50))

alert.on(spike && d > 0, "Buying spike", "{{ticker}} {{interval}}: taker buying spike")
alert.on(spike && d < 0, "Selling spike", "{{ticker}} {{interval}}: taker selling spike")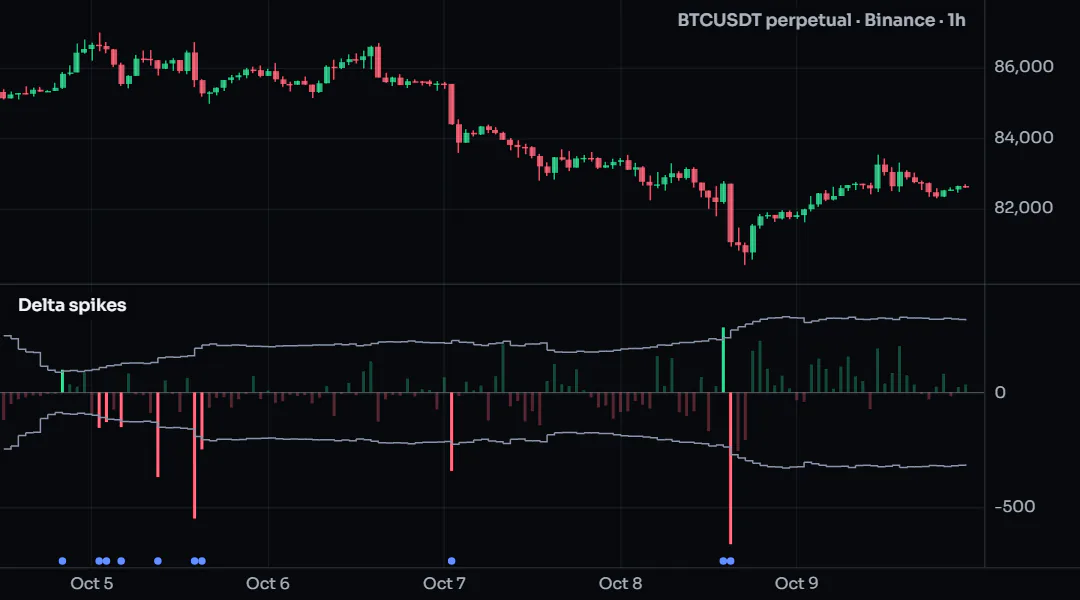
#How it works
flow.deltais read likevolume: one value per bar, in the base coin.math.abs(nz(d))turns every bar into a size (andnainto 0) before averaging, so buys and sells count alike.- A spike is a bar more than
multtimes the usual size; it is drawn in full color, the rest faded. - Two step lines show the threshold on both sides of zero.
#Customize it
- Show delta as a share of volume instead:
plot(flow.buy_share - 0.5, ...)gives -0.5 (all sells) to +0.5 (all buys). - Mark spikes on the price pane too: add
plotshape(spike, ..., { force_overlay: true }). - On an exchange whose candles carry no taker volume, use the all-exchange
flow.agg_delta(Pro) instead.
#Run it
Use a Binance or Aster chart, or a tick or range chart. Read the ChartDeck data table for which candles carry taker volume.
#Concepts used
ChartDeck data, nz, plot styles.
#Big prints on the chart
A single large trade tells you someone was willing to pay the spread for size. This script puts a dot on every print above an automatic threshold (the 99.9th percentile of the market's recent prints, as the built-in Large prints study uses), sized by value, and plots the bar's big-print delta in the Data Window.
Data: flow.prints. Plan: every plan; how far back the prints reach depends on your plan (15 minutes on Beginner up to 24 hours on Elite) and on whether the market was being recorded. Without the data: older bars get an empty array and show nothing.
#The script
//@chartscript 1
indicator("Big prints", { overlay: true, max_labels_count: 500 })
const pct = input.float(99.9, "Auto threshold, percentile", { options: [99, 99.5, 99.9] })
const fallback = input.float(250000, "Threshold before Auto is known (USD)", { minval: 0 })

const thr = nz(flow.print_threshold(pct), fallback)
let buyUsd = 0.0
let sellUsd = 0.0
for (const p of flow.prints(thr)) {
    // bigger dots for bigger trades: 1x, 3x and 10x the threshold
    const sz = p.notional >= 10 * thr ? size.normal : p.notional >= 3 * thr ? size.small : size.tiny
    const col = p.side > 0 ? color.new(color.up, 40) : color.new(color.down, 40)
    label.new(p.time, p.price, "", xloc.bar_time, yloc.price, col, label.style_circle, na, sz,
        { tooltip: (p.side > 0 ? "Buy " : "Sell ") + str.tostring(p.notional, format.volume) + " at " + str.tostring(p.price) })
    if (p.side > 0) {
        buyUsd += p.notional
    } else {
        sellUsd += p.notional
    }
}
plot(buyUsd - sellUsd, "Big-print delta (USD)", color.accent, { display: display.data_window })
if (barstate.islast) {
    legend.info("prints from " + str.tostring(thr, format.volume))
}
No picture: this example reads ChartDeck’s recorded market data (open interest, funding, liquidations, trade prints, footprints, the order book or volume at price), which the picture’s candles do not carry. Open it in the editor to see it on a live chart.
#How it works
flow.print_threshold(pct)isnauntil enough prints were seen;nz(..., fallback)gives a fixed value until then.flow.prints(thr)is the bar's prints worth at leastthr, oldest first, each withtime,price,size,sideandnotional.- Each print becomes a label placed by time (
xloc.bar_time), so it sits at its real moment inside the bar. lettotals start at zero on every bar; the difference goes to the Data Window only.- The legend shows the threshold in use.
#Customize it
- Only buyers:
flow.prints(thr, "buy"). - The coin's Binance prints on another exchange's chart:
flow.prints(thr, "both", "binance")andflow.print_threshold(pct, "binance"); draw them atclose, since Binance's price may differ. - Raise
max_labels_count(up to the limit) on busy markets.
#Run it
Open a 1- to 5-minute chart of a liquid market and leave it open: the live tape adds prints as they happen. Prints are live data, not candles, so a chart opened tomorrow will not show today's prints beyond your plan's window.
#Concepts used
Trade prints, loops, text and shapes, legend items.
#CVD divergence
Cumulative volume delta (CVD) adds up delta bar after bar. When price makes a higher high but CVD makes a lower one, the new high was reached with less aggressive buying: a classic warning. The mirror at lows is a bullish sign. This script finds swing highs and lows with pivots and compares CVD at the two most recent ones.
Data: flow.cvd, the cumulative delta of the coin's Binance perpetual, on any chart; or the chart's own delta. Plan: every plan, within your plan's order-flow window. Without the data: with the Binance source and no Binance perpetual for the coin the line is na and no mark appears; switch the source to This chart.
#The script
//@chartscript 1
indicator("CVD divergence", { max_labels_count: 200 })
const source = input.string("Binance perpetual", "CVD source", { options: ["Binance perpetual", "This chart"] })
const span = input.int(5, "Pivot: bars on each side", { minval: 2, maxval: 30 })

// the chart's own CVD: delta summed from the first bar with taker volume
state ownCvd: float = na
if (!na(flow.delta)) {
    ownCvd = nz(ownCvd) + flow.delta
}
const cvd = source == "This chart" ? ownCvd : flow.cvd

// pivots are confirmed `span` bars late; read CVD at the pivot bar with [span]
const ph = ta.pivothigh(high, span, span)
const pl = ta.pivotlow(low, span, span)
const prevPh = ta.valuewhen(!na(ph), ph, 1)
const prevCvdAtPh = ta.valuewhen(!na(ph), cvd[span], 1)
const prevPl = ta.valuewhen(!na(pl), pl, 1)
const prevCvdAtPl = ta.valuewhen(!na(pl), cvd[span], 1)

const bearish = !na(ph) && ph > prevPh && cvd[span] < prevCvdAtPh
const bullish = !na(pl) && pl < prevPl && cvd[span] > prevCvdAtPl

plot(cvd, "CVD", color.accent, 2)
if (bearish) {
    label.new(bar_index - span, cvd[span], "Bearish", { style: label.style_label_down, color: color.down, textcolor: color.white, size: size.small })
}
if (bullish) {
    label.new(bar_index - span, cvd[span], "Bullish", { style: label.style_label_up, color: color.up, textcolor: color.white, size: size.small })
}
alert.on(bearish, "Bearish CVD divergence", "{{ticker}}: higher high in price, lower high in CVD")
alert.on(bullish, "Bullish CVD divergence", "{{ticker}}: lower low in price, higher low in CVD")
No picture: this example reads ChartDeck’s recorded market data (open interest, funding, liquidations, trade prints, footprints, the order book or volume at price), which the picture’s candles do not carry. Open it in the editor to see it on a live chart.
#How it works
- An option input switches between the Binance perpetual's CVD (
flow.cvd) and a CVD the script sums itself from the chart'sflow.delta. ownCvdis astatevalue that staysnauntil the first bar with taker volume, then accumulates.ta.pivothigh(high, span, span)is notnaon the bar where a swing high is confirmed,spanbars after it. The CVD at the swing is thereforecvd[span].ta.valuewhen(cond, value, 1)is the value at the previous time the condition was true: the previous swing.- The label is placed back on the swing bar (
bar_index - span); the alert fires on the bar the divergence is known.
#Customize it
- Wider swings: raise the pivot span to 10.
- Use all exchanges (Pro):
flow.agg_cvdinstead offlow.cvd. - Compare spot and perpetuals: plot
flow.spot_cvdbesideflow.cvd.
#Run it
Any perpetual or spot chart of a coin Binance lists, 5-minute to 4-hour. CVD starts where your script's bars start, so compare its changes, never its level against another chart.
#Concepts used
ChartDeck data, state, repainting and pivots, inputs with options.
#Absorption from footprints
Absorption is aggressive selling that fails to push price down: sellers hit the bid hard at the low, a passive buyer takes it all, and the bar closes near its high. The footprint says where inside the bar the selling happened, so a script can test it directly. The mirror (heavy buying at the high, close near the low) is absorption of buyers.
Data: footprints (fp.*) of the chart's market. Plan: Pro and Elite. Without the data: on other plans, or on a market or timeframe without footprints, every fp value is na, no mark appears, and the legend says why.
#The script
//@chartscript 1
indicator("Absorption", { overlay: true })
const minShare = input.float(15, "Zone delta at least this % of the bar's volume", { minval: 1, maxval: 100, step: 1 })
const closeIn = input.float(40, "Close within this % of the far end", { minval: 5, maxval: 50, step: 5 })

const vol = fp.buy_vol + fp.sell_vol
const range = high - low
const closePos = range > 0 ? (close - low) / range * 100 : 50

// sellers pressed at the low (net selling in the low zone, the hardest-selling row in the bottom quarter) ...
const sellAtLow = fp.available && vol > 0 && fp.low_delta < 0 && -fp.low_delta >= minShare / 100 * vol && fp.min_delta_px <= low + range * 0.25
// ... and the bar still closed near its high
const buyAbsorb = sellAtLow && closePos >= 100 - closeIn
const buyAtHigh = fp.available && vol > 0 && fp.high_delta > 0 && fp.high_delta >= minShare / 100 * vol && fp.max_delta_px >= high - range * 0.25
const sellAbsorb = buyAtHigh && closePos <= closeIn

plotshape(buyAbsorb, "Sellers absorbed", shape.circle, location.belowbar, color.up, { size: size.small })
plotshape(sellAbsorb, "Buyers absorbed", shape.circle, location.abovebar, color.down, { size: size.small })
plot(fp.available ? fp.min_delta_px : na, "Hardest selling row", color.new(color.down, 60), 1, plot.style_circles)
alert.on(barstate.isconfirmed && buyAbsorb, "Sellers absorbed", "{{ticker}} {{interval}}: heavy selling at the low, closed near the high")
alert.on(barstate.isconfirmed && sellAbsorb, "Buyers absorbed", "{{ticker}} {{interval}}: heavy buying at the high, closed near the low")
No picture: this example reads ChartDeck’s recorded market data (open interest, funding, liquidations, trade prints, footprints, the order book or volume at price), which the picture’s candles do not carry. Open it in the editor to see it on a live chart.
#How it works
fp.availableistrueonly on bars that have footprint rows; every test starts with it.fp.low_deltais the net delta of the bar's low zone (the bottom quarter of its rows);fp.min_delta_pxis the middle of the row where sellers hit hardest.- The thresholds are relative (a share of the bar's own volume, a position inside its own range), so they work on any coin and timeframe.
- The alerts use
barstate.isconfirmed: a forming bar's footprint changes until it closes.
#Customize it
- Stricter: require
fp.low_read == -1(the Footprint chart's Extremes reading "responsive" at the low). - Look inside the bar with lower timeframes:
request.lower_tf("1", fp.min_delta)gives each 1-minute delta. - Add a volume filter so only busy bars count:
vol > ta.sma(vol, 20).
#Run it
A Pro or Elite plan, a 1- to 15-minute chart of a market ChartDeck records (the main Binance, Bybit, OKX and Hyperliquid markets among others). It reads the same footprint the Footprint chart type draws.
#Concepts used
Footprints, plotshape, alerts.
#Stacked-imbalance zones
A stacked imbalance is three or more price rows in a row where one side traded at least three times the other side's volume on the diagonal. Such a band often acts as support or resistance later. This script draws each stack as a zone and keeps it until a bar closes back through it.
Data: footprint rows (fp.stacks). Plan: Pro and Elite. Without the data: fp.stacks returns an empty array and nothing is drawn.
#The script
//@chartscript 1
indicator("Stacked-imbalance zones", { overlay: true, max_boxes_count: 200 })
const ratio = input.float(3, "Imbalance ratio", { minval: 1.5, step: 0.5 })
const minRows = input.int(3, "Rows in a stack", { minval: 2, maxval: 10 })
const keep = input.int(30, "Zones to keep", { minval: 1, maxval: 150 })

type Zone {
    b: box
    lo: float
    hi: float
    side: int
}
state zones = array.new<Zone>()

// new stacks of the bar that just closed
if (barstate.isconfirmed) {
    for (const s of fp.stacks(0, ratio, minRows)) {
        const col = s.side > 0 ? color.up : color.down
        const bx = box.new(time, s.hi, time_close, s.lo, { xloc: xloc.bar_time, extend: extend.right,
            bgcolor: color.new(col, 80), border_color: color.new(col, 50) })
        zones.push(Zone.new(bx, s.lo, s.hi, s.side))
    }
}

// a buy zone ends when a bar closes below it, a sell zone when a bar closes above it
if (zones.size() > 0) {
    for (let i = zones.size() - 1 to 0) {
        const z = zones.get(i)
        if ((z.side > 0 && close < z.lo) || (z.side < 0 && close > z.hi)) {
            z.b.set_extend(extend.none)
            z.b.set_right(time_close)
            zones.remove(i)
        }
    }
}
while (zones.size() > keep) {
    zones.shift()
}
plot(fp.stack_buy_count - fp.stack_sell_count, "Buy minus sell stacks", color.accent, { display: display.data_window })
alert.on(barstate.isconfirmed && fp.stack_buy_count > 0, "Buy stack", "{{ticker}}: a buy stacked imbalance formed")
No picture: this example reads ChartDeck’s recorded market data (open interest, funding, liquidations, trade prints, footprints, the order book or volume at price), which the picture’s candles do not carry. Open it in the editor to see it on a live chart.
#How it works
- A user type
Zonekeeps a box with its prices and side;state zoneskeeps the open ones across bars. fp.stacks(0, ratio, minRows)gives this bar's stacks, each withside,loandhi, using the Footprint chart's own rule.- New zones are created only on closed bars, so a forming bar never adds a zone that later disappears.
- The loop walks the array backwards (
for (let i = size - 1 to 0)), so removing an item does not skip the next one. - A finished zone stops extending and keeps its right edge at the bar that ended it.
#Customize it
- Only buy zones: skip stacks with
s.side < 0. - A notional minimum on the dominant side:
fp.stacks(0, ratio, minRows, 50000). - End a zone on a touch instead of a close: compare
lowandhighinstead ofclose.
#Run it
A Pro or Elite plan and a 1- to 15-minute chart with footprints. The rows are the recorded grid, so the zones are the same at every zoom and on ChartDeck's servers. The house Stacked Imbalances indicator draws the same stacks with more options.
#Concepts used
Footprints: stacked imbalances, user types, collections, drawings.