

Quick reference
Dense tables of ChartScript on one page - the declarations, built-in variables, ChartDeck data series with units, input kinds, drawing types and outputs.
One page to keep open while you write. Every name links to its card in the reference manual, which has the full signature, every parameter and an example. The tables below the first one are built from the same registry as the editor's help, so they always match the language.
#The shape of a script
//@chartscript 1
indicator("Shape of a script", { overlay: true })
// 1. settings
const len = input.int(20, "Length", { minval: 1 })
// 2. calculations (run once per bar)
const avg = ta.sma(close, len)
state crosses = 0
if (ta.cross(close, avg)) {
    crosses += 1
}
// 3. outputs
plot(avg, "Average", color.accent, 2)
plotshape(ta.crossover(close, avg), "Cross up", shape.triangleup, location.belowbar, color.up)
alert.on(ta.crossover(close, avg), "Cross up", "{{ticker}} crossed its average")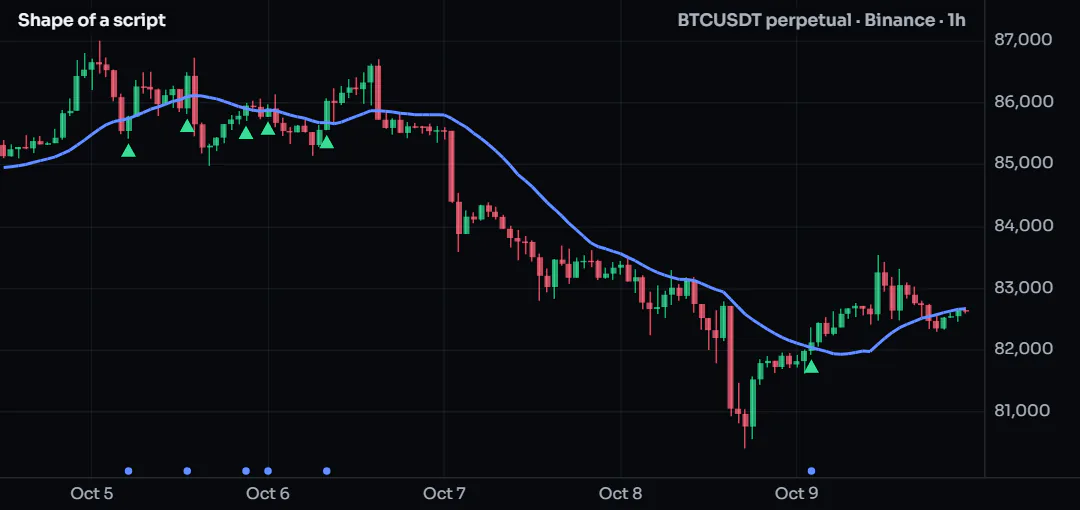
#Declarations
| Written as | What it does | Read more |
|---|---|---|
//@chartscript 1 | The first line of every script: the language version | Execution model |
indicator(title, { overlay, format, precision, website, max_labels_count, max_lines_count, max_boxes_count, ... }) | Declares an indicator; overlay: true draws on the price pane; website links your site beside the script's name | indicator |
library(title) with export function ... | Declares a library other scripts import | Libraries |
import * as T from "@user/Name@1" | Uses a library | Libraries |
const h = link.script("@user/Name@1", { inputs, at }) | Links another script's shares | Linking scripts |
const x = ..., let x = ... | A value computed on every bar (let may be reassigned) | Variables |
state x = 0 | A value kept from bar to bar | Variables |
function f(a, b = 2) { ... return v } | A function; each call keeps its own state | Functions |
type Zone { lo: float \n hi: float } | A user type with fields | User types |
#Built-in variables
| Name | Type | What it is |
|---|---|---|
bar_index | int | The bar number: 0 = the first bar of the run. |
barstate.isconfirmed | bool | true when the bar is closed (and on the final run of a closing bar). |
barstate.isfirst | bool | true on the first bar. |
barstate.ishistory | bool | true on closed bars of the history. |
barstate.islast | bool | true on the last bar. |
barstate.islastconfirmedhistory | bool | true on the last closed bar of the history. |
barstate.isnew | bool | true on the first run of a live bar. |
barstate.isrealtime | bool | true on the live bar. |
chart.bg_color | color | The chart background colour (a theme colour). |
chart.fg_color | color | The chart text colour (a theme colour). |
chart.is_heikinashi | bool | true when the chart shows Heikin-Ashi candles. |
chart.is_standard | bool | true when the chart shows standard candles. |
chart.left_visible_bar_time | int | The time of the leftmost visible bar (ms). |
chart.right_visible_bar_time | int | The time of the rightmost visible bar (ms; the last bar when the chart shows the present). |
chart.theme | string | The chart theme: "dark", "light" or "hc" (the script re-runs when it changes). |
close | float | The close of the bar (the last price on the live bar). |
dayofmonth | int | The day of the month of the bar open (UTC). |
dayofweek | int | The day of the week of the bar open (dayofweek.sunday = 1, UTC). |
high | float | The high of the bar. |
hl2 | float | (high + low) / 2. |
hlc3 | float | (high + low + close) / 3. |
hlcc4 | float | (high + low + close + close) / 4. |
hour | int | The hour of the bar open (UTC). |
last_bar_index | int | The bar_index of the last bar. |
last_bar_time | int | The open time of the last bar of the chart (ms, UTC). |
low | float | The low of the bar. |
minute | int | The minute of the bar open (UTC). |
month | int | The month of the bar open (1-12, UTC). |
ohlc4 | float | (open + high + low + close) / 4. |
open | float | The open of the bar. |
second | int | The second of the bar open (UTC). |
time | int | The open time of the bar (ms, UTC). |
time_close | int | The close time of the bar (ms, UTC). |
time_tradingday | int | The start of the trading day of the bar (crypto: 00:00 UTC of the bar's day). |
timeframe.isdaily | bool | true for day timeframes. |
timeframe.isdwm | bool | true for day, week and month timeframes. |
timeframe.isintraday | bool | true below one day. |
timeframe.isminutes | bool | true for minute timeframes. |
timeframe.ismonthly | bool | true for month timeframes. |
timeframe.isseconds | bool | true for second timeframes. |
timeframe.isticks | bool | true for tick charts (never on ChartDeck). |
timeframe.isweekly | bool | true for week timeframes. |
timeframe.main_period | string | The chart timeframe, also inside a request. |
timeframe.multiplier | int | The number in the timeframe (60 for "60", 1 for "1D"). |
timeframe.period | string | The chart timeframe ("60", "1D" ...). |
timenow | int | The current time (ms, UTC); differs between runs. |
volume | float | The volume of the bar (base units). |
weekofyear | int | The ISO week of the bar open (UTC). |
year | int | The year of the bar open (UTC). |
#ChartDeck data series
One value per bar, like close. Units, markets and plans are in ChartDeck data; a series reads na where its market or your plan has no data.
| Name | Type | What it is |
|---|---|---|
basis.cb_premium | float | Coinbase premium in percent: (Coinbase USD close ÷ Binance USDT spot close − 1) × 100 for the chart’s coin (BTC when Coinbase does not list it; OKX spot when Binance does not answer; the Coinbase premium study). |
basis.pct | float | Perpetual over spot, in percent: (perp close ÷ spot close − 1) × 100, against the same exchange’s spot market or Binance spot (the Perp/spot basis study). |
etf.net_flow | float | US spot-ETF net flow for the chart’s coin, USD per US trading day (the ETF net flows study; BTC, ETH, SOL, HYPE, ZEC and a few more). |
flow.agg_buy | float | Taker buys of the bar summed over every exchange ChartDeck merges for the coin, perpetuals and spot, in USD (the quote currency; the Aggregated delta / CVD study’s data). |
flow.agg_cvd | float | All-exchange cumulative delta, perpetuals and spot, in USD: flow.agg_delta summed from the first loaded bar with flow (the Aggregated delta / CVD study’s line). |
flow.agg_delta | float | All-exchange delta of the bar: flow.agg_buy minus flow.agg_sell, in USD (the Aggregated delta / CVD study’s bars). |
flow.agg_perp_cvd | float | All-exchange cumulative delta of the coin’s perpetuals only, in USD, from the first loaded bar with flow. |
flow.agg_sell | float | Taker sells of the bar summed over every exchange, perpetuals and spot, in USD (see flow.agg_buy). |
flow.agg_spot_cvd | float | All-exchange cumulative delta of the coin’s spot markets only, in USD, from the first loaded bar with spot flow; na on bars where only perpetuals were recorded. |
flow.big_buy_usd | float | The value (USD) of the chart’s Big trades on taker buys in the bar: the piles the Big trades row draws (one bar, one side, prices within the pile band), at the chart’s Big trades size (Chart settings: a fixed size, else |
flow.big_count | float | How many Big trades bubbles (piles) the bar has, both sides. |
flow.big_sell_usd | float | The same for taker sells. |
flow.buy_share | float | The taker-buy share of the bar’s volume, 0 to 1 (0.5 = balanced; the Volume study’s flow colouring). |
flow.buy_vol | float | Taker-buy volume of the bar, base coin (the same split as the Volume delta study). |
flow.cvd | float | Cumulative volume delta of the coin’s Binance perpetual, in USDT (the CVD study’s perp line): cumulative over the loaded bars, starting at the first bar with flow; na on a bar with no flow yet. |
flow.delta | float | Volume delta of the bar: taker buy minus taker sell, base coin (the Volume delta study). |
flow.sell_vol | float | Taker-sell volume of the bar, base coin: volume minus flow.buy_vol. |
flow.spot_cvd | float | Cumulative volume delta of the coin’s Binance spot market, in USDT (the CVD study’s spot line); na where Binance lists no spot pair, and on tick / range charts. |
fp.available | bool | true when the bar has footprint rows (the Footprint chart’s data for the chart’s own market and timeframe). |
fp.buy_vol | float | Buy volume of the bar summed over its rows (trades that lifted the ask), base coin. |
fp.delta | float | fp.buy_vol minus fp.sell_vol. |
fp.high_delta | float | Net delta of the bar’s high zone: the top 25 % of its rows (2 at least). |
fp.high_read | int | The Extremes reading of the high zone: 1 = initiative (buying at the high), -1 = responsive (selling at the high), 0 = neither side clear. |
fp.low_delta | float | Net delta of the bar’s low zone: the bottom 25 % of its rows (2 at least), the Footprint chart’s Extremes zone. |
fp.low_read | int | The Footprint chart’s Extremes reading of the low zone, with its default settings: 1 = initiative (selling at the low), -1 = responsive (buying at the low), 0 = neither side clear (the zone holds under 20 % of the bar’s |
fp.max_buy_px | float | The middle price of the row with the most buy volume. |
fp.max_buy_qty | float | The buy volume of that row, base coin. |
fp.max_delta | float | The delta of that row. |
fp.max_delta_px | float | The middle price of the row with the most positive delta: where buyers lifted hardest. |
fp.max_sell_px | float | The middle price of the row with the most sell volume. |
fp.max_sell_qty | float | The sell volume of that row, base coin. |
fp.min_delta | float | The delta of that row (negative when sellers dominated it). |
fp.min_delta_px | float | The middle price of the row with the most negative delta (buys minus sells): where sellers hit hardest. |
fp.poc | float | The middle price of the row with the most volume (the bar’s point of control; on a tie the lower row). |
fp.row_size | float | The row height in price used for every fp.* value of the bar (the recorded grid: 50 rows per 1 % of price, BTC $20). |
fp.sell_vol | float | Sell volume of the bar summed over its rows (trades that hit the bid), base coin. |
fp.stack_buy_count | int | How many buy stacked imbalances the bar holds, with the Footprint chart’s default rule: 3 or more rows in a row whose buys are at least 3 × the sells one row lower, the buys at least half the bar’s median row (fp.stacks |
fp.stack_sell_count | int | How many sell stacked imbalances the bar holds (sells at least 3 × the buys one row higher, 3 or more rows in a row; see fp.stack_buy_count). |
funding.agg_mean | float | Funding across the venues listing the coin, simple mean, in percent per 8 hours (the Aggregated funding study’s line). |
funding.agg_weighted | float | Funding across the venues listing the coin, weighted by open interest, in percent per 8 hours (the Aggregated funding study’s bars). |
funding.interval_hours | float | The venue’s funding interval in hours (8 on most venues, 1 on Hyperliquid); na before the first answer. |
funding.rate | float | The funding rate in force at each bar, in percent per funding interval (the Funding rate study; see funding.interval_hours). |
funding.settled | bool | true on a bar that holds a funding settlement (the Funding rate study draws those bars stronger). |
hl.coverage | float | The share of the bar’s Hyperliquid aggressor volume whose trader’s position was known, in percent (0 to 100): the part the hl.* values count. |
hl.long_close | float | Long positions closed by the aggressors of the bar’s Hyperliquid trades, base coin (a sell while long, up to the size held). |
hl.long_open | float | Long positions opened by the aggressors of the bar’s Hyperliquid trades, base coin (a buy while flat or long; the part of a flip beyond zero). |
hl.net_long_delta | float | Hyperliquid net longs delta of the bar, base coin: long positions opened minus long positions closed by the aggressor (taker) of each trade (hl.long_open − hl.long_close; the HL Net Longs Delta study summed over the bar’ |
hl.net_short_delta | float | Hyperliquid net shorts delta of the bar, base coin: short positions opened minus short positions closed by the aggressor of each trade (hl.short_open − hl.short_close; the HL Net Shorts Delta study summed over the bar’s |
hl.short_close | float | Short positions closed (covered) by the aggressors of the bar’s Hyperliquid trades, base coin (a buy while short, up to the size held). |
hl.short_open | float | Short positions opened by the aggressors of the bar’s Hyperliquid trades, base coin (a sell while flat or short; the part of a flip beyond zero). |
liq.long_liq_usd | float | Longs liquidated in the bar, USD, as the Liquidation candles mark them at the bar’s own timeframe: exact prints where ChartDeck records them (bars under 1 h, the last day), else hourly rows (on bars under 1 h on the bar |
liq.long_usd | float | Long liquidations in USD, measured from the venues that publish them (the Liquidations study, as a positive number). |
liq.short_liq_usd | float | Shorts liquidated in the bar, USD (see liq.long_liq_usd). |
liq.short_usd | float | Short liquidations in USD (the Liquidations study). |
liq.total_usd | float | Long plus short liquidations in USD; na where neither has a value. |
lsr.accounts | float | Long/short ratio of all accounts on the chart’s venue (1 = balanced; the Long/short ratio study, All accounts). |
lsr.margin | float | Bitfinex margin positions, long ÷ short, on the coin’s USD pair (the Long/short ratio study on a Bitfinex chart); na on other venues. |
lsr.top | float | Long/short ratio of the top traders’ positions on the chart’s venue (the Long/short ratio study, Top traders). |
oi.agg | float | Open interest summed over every perpetual venue with OI history, in coins (the Aggregated open interest study). |
oi.agg_usd | float | Aggregated open interest in USD: oi.agg × close, per coin. |
oi.close | float | Open interest of the chart’s market, in coins: the last sample in force at each bar’s end (a step series, never interpolated; the Open interest study). |
oi.delta | float | Change in open interest on the bars where a new sample landed, in coins (the OI delta study); na on bars between two samples. |
oi.ref | float | Open interest of the coin’s Binance perpetual (USDT-margined), on any chart: a MEXC or BloFin chart reads Binance’s figure (the Open interest study run on Binance; the last sample in force at each bar’s end). |
oi.ref_usd | float | oi.ref in USD: the Binance units × the chart’s close, per coin (a 1000PEPE unit counts 1,000 coins). |
oi.usd | float | Open interest of the chart’s market in USD: oi.close × close, per coin (a 1000PEPE or kPEPE market counts 1,000 coins per unit). |
#ChartDeck record data
Lists for a bar (prints, footprint rows, liquidation events) or for now (liquidation levels, the order book).
| Name | Returns | What it is |
|---|---|---|
flow.big_since | int | The time (ms) from which the Big trades the script reads are held (bars before it read na), na without data. |
flow.big_threshold | float | The Big trades size in use (USD): the chart’s fixed size, else the Auto size (the server’s hour of trades). |
flow.big_trades | array<flow.big_trade> | The chart’s Big trades bubbles of a bar, by time: the piles the Big trades row draws (every pile, not only those a view draws), at the chart’s size and exchanges. |
flow.print_threshold | float | The notional value (price x size) that the given share of the market's recent prints stay under: 99, 99.5 and 99.9 from the server's last hour, 95 and 98 (or when the server has too few) from the live trade tape's newest |
flow.prints | array<flow.print> | This bar's large trades from ChartDeck's trade tape: prints of at least min_notional (quote currency), oldest first. |
flow.prints_since | int | The time (ms) of the oldest print ChartDeck holds for this market (days back once the stored history has loaded), na when it holds none. |
fp.delta_at | float | The delta (buys minus sells) of the row holding price in a bar: 0 for a row inside the bar’s range where nothing traded, na outside its rows or where the bar has no footprint. |
fp.imbalance_at | int | The diagonal imbalance of the row holding price in a bar, with the rule of fp.stacks: 1 = buy imbalance, -1 = sell imbalance, 0 = none; na outside the bar’s rows or where the bar has no footprint. |
fp.rows | array<fp.row> | The footprint rows of a bar on the recorded grid, low to high: an array of fp.row (at most 400; on a wider bar the 400 around its point of control). |
fp.since | int | Where the footprint history the script can read starts: the time (ms) of the first bar with footprint rows, na when there is none. |
fp.stacks | array<fp.stack> | The stacked imbalances of a bar, with the Footprint chart’s own rule, on the recorded grid (the same at every zoom, on the server and in alerts): rows whose buys are at least ratio × the sells one row LOWER (buy) or whos |
liq.burst | int | 1 when a minute of the bar is a liquidation BURST: the USD liquidated on that side in one minute, summed over Binance, Bybit, OKX and Gate (the exchanges ChartDeck records single liquidations of; Binance publishes at mos |
liq.cascade | int | 1 when a minute of the bar ends a CASCADE: three rising one-minute sums of that side in a row, the last a burst (see liq.burst). |
liq.climax | int | 1 when a minute of the bar ends a liquidation CLIMAX: the last five minutes liquidated (both sides) at least the coin’s 99.9th percentile of five-minute sums of the 30 days before that day. |
liq.events | array<liq.event> | The liquidations the Liquidation candles mark on a bar, by time: exact prints and hourly rows, on the bar the candles place them. |
liq.events_since | int | The time (ms) the liquidation data starts (7 days back, 30 on Elite), na without data. |
liq.heat | heatmap.column | The liquidation model's heat over this bar (the built-in Liquidation Heatmap's data, hourly columns): a heatmap.column, or na where there is no data. |
liq.is_model | bool | true when the liquidation levels are a model estimate, false when they are observed positions of a pinned venue. |
liq.levels | array<liq.level> | The liquidation model's levels now (the same data as the built-in Liquidation Levels study): an array of liq.level. |
liq.updated | int | When the liquidation data was last updated (ms), na without data. |
liq.venues | string | The venues the liquidation data covers, as text, for example "All venues (14)". |
liq.window | string | The liquidation model window: "7d" or "30d". |
#Input kinds
| Name | Returns | What it is |
|---|---|---|
input.bool | bool | An on/off setting. |
input.color | color | A color setting: a swatch on the Inputs tab (in its section) or, without sections or tabs, on the Style tab, and always on the Colors tab, where the color presets use its role. |
input.duration | int | A length of time ("4h", "30m", "2d", "1w" or "120b" for bars) given to the script as bars at the chart timeframe (at least 1). |
input.enum | T | A select of the items of an enum (their titles are shown). |
input.float | float | A number setting. |
input.font | string | A font setting (the fonts the terminal ships). |
input.gradient | string | A gradient setting (a stop editor). |
input.int | int | A whole-number setting. |
input.linestyle | string | A line style setting: solid, dashed, dotted, dash-dot, long dash or a custom dash. |
input.list | array<string> | Several choices at once (chips): an array of the chosen options, in the options' order. |
input.ma_type | string | A moving-average type setting (the 11 ChartDeck types; ChartDeck extra). |
input.market | string | A market setting (VENUE:SYMBOL, the market search). |
input.palette | string | A palette setting: the member picks one of the palettes and may edit its colours. |
input.position | string | A position setting (a 3 x 3 picker). |
input.price | float | A price setting. |
input.range | tuple<float,float> | A low / high pair (a two-thumb slider); low ≤ high always holds. |
input.script | T | A setting where the member picks the script to link. |
input.session | string | A session setting ("HHMM-HHMM", UTC). |
input.shape | shape_style | A shape setting (an icon grid). |
input.size | size | A text size setting: pixels, points or relative, with the named sizes as chips. |
input.source | float | A price-source setting (close, open, high, low, volume, hl2, hlc3, ohlc4, hlcc4). |
input.string | string | A text setting (a select with options). |
input.text_area | string | A multi-line text setting (up to 2,000 characters). |
input.textstyle | string | A text style setting: size, font, weight, italic, colour, halo and background in one row. |
input.time | int | A time setting (ms, UTC). |
input.timeframe | string | A timeframe setting. |
#Drawing types
| Name | Returns | What it is |
|---|---|---|
box.new | box | A box between two bars and two prices. |
drawing.position | drawing | A Long or Short position drawn with the drawing tools' own Long position / Short position look: the target zone, the stop zone, the entry line and the tags (target and stop with the move, % and ticks or P&L, the middle t |
heatmap.new | heatmap | A new heatmap. Columns are added with column, add or cell; the chart paints all of them as one image per pane, coloured by value on the palette. |
label.new | label | A label at (x, y): a bar index (or a time with xloc.bar_time) and a price. |
line.new | line | A line from (x1, y1) to (x2, y2). |
linefill.new | linefill | Fills the space between two lines (it goes when either line goes). |
polyline.new | polyline | A line through up to 10,000 chart.points (curved, closed and filled if asked). |
table.new | table | A table in a corner of the pane (position.*), one per position (9). |
tag.new | tag | A level. tag.place_chart draws its line and writes its name on the chart beside the line’s start (as the chart’s Pivots); the axis looks put the name in a filled tag inside the pane against the price axis and the price i |
#Plots, colors, alerts and the legend
| Name | Returns | What it is |
|---|---|---|
alert.on | A named alert condition that "Create alert" lists. | |
alert.send | Sends an alert message from the script). | |
barcolor | Colours the chart candles on each bar (na: the chart's own colour). | |
bgcolor | Colours the pane background on each bar (na: no colour). | |
fill | Fills between two plots or two hlines; the gradient form colours each bar from top_color at top_value to bottom_color at bottom_value. | |
hline | hline | A horizontal level (the first 12 are editable study levels). |
legend.badge | Shows a small outlined badge at the end of the legend row, such as "Model estimate". | |
legend.info | Shows text in the legend row after the script name (from the newest bar). | |
legend.key | Shows a colour key in the legend row: a swatch and its text. | |
plot | plot | Draws a series. The result can be used by fill(). |
plotarrow | Draws an up arrow for positive values and a down arrow for negative ones. | |
plotbar | Draws OHLC bars. | |
plotcandle | Draws candles. | |
plotchar | Draws one character on bars where the series is true (or not na). | |
plotshape | Draws a shape on bars where the series is true (or not na). |
#Sharing and linking
| Name | Returns | What it is |
|---|---|---|
link.script | T | Links another script and gives a handle to what it shares: h.<id> is a shared series (with history), h.levels.<id> the levels active on this bar (array<level>, sorted by price), h.events.<id> the events delivered on this |
share.event | Shares "this happened on this bar". | |
share.level | Shares a price level (or a zone with top and bottom) that stays active until share.level_end. | |
share.level_end | Ends an active shared level. | |
share.series | Shares one value per bar under an id. |