

Recipes: signals and backtests
Measure a signal honestly in an indicator - a long and short backtest in R with stops, targets and costs, and forward returns against a baseline.
ChartScript has no strategy(...) scripts yet and never places orders (Strategies). You can still measure a signal: track a hypothetical position yourself in state variables, on closed bars, and report the results in a table. These two recipes do that. Treat their numbers as a first look at an idea, not as a test of a trading system: there is no slippage, no funding and no position sizing, and a bar that touches both the stop and the target is counted as a stop (the cautious choice), because one bar cannot say which came first.
| Recipe | What it does | What it teaches |
|---|---|---|
| A simple backtest in R | EMA-cross trades, long and short, with an ATR stop, a target in R and a cost per trade; results in R | tracking a position in state, closed bars only, a results table |
| Forward returns after a signal | The average move N bars after a signal, next to the average move after any bar | measuring against a baseline, state arrays, array.avg |
#A simple backtest in R
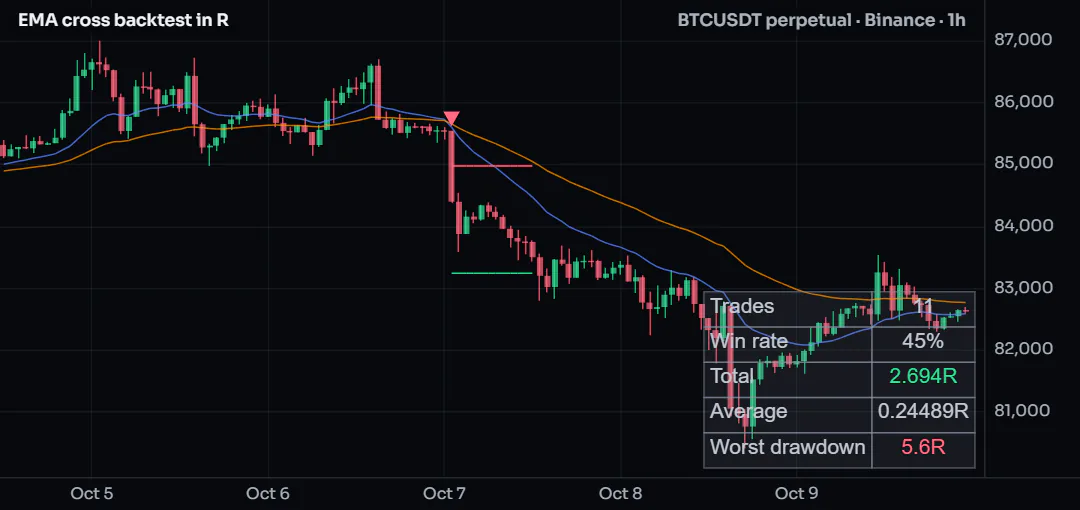
R is the risk of one trade: the distance from entry to stop. Counting results in R makes trades on any coin and timeframe comparable: +2R is a target of twice the risk, -1R a full stop. This script enters on a confirmed EMA cross, exits at the stop or the target, subtracts a cost per trade, and keeps the totals.
Data: candles only. Plan: every plan. The results cover the bars your script runs on (bars per run).
#The script
//@chartscript 1
indicator("EMA cross backtest in R", { overlay: true })
const fastLen = input.int(20, "Fast EMA", { minval: 2 })
const slowLen = input.int(50, "Slow EMA", { minval: 3 })
const stopAtr = input.float(1.5, "Stop, x ATR", { minval: 0.1, step: 0.1 })
const targetR = input.float(2.0, "Target, in R", { minval: 0.1, step: 0.1 })
const costPct = input.float(0.08, "Cost per trade, % of entry (fees both ways)", { minval: 0, step: 0.01 })

const fast = ta.ema(close, fastLen)
const slow = ta.ema(close, slowLen)
const atr = ta.atr(14)

state dir = 0            // 1 long, -1 short, 0 flat
state entry: float = na
state stop: float = na
state target: float = na
state trades = 0
state wins = 0
state sumR = 0.0
state peakR = 0.0
state maxDrawR = 0.0

// 1. manage an open trade on the bar's close (the stop first: the cautious reading of a bar that touched both)
if (dir != 0 && barstate.isconfirmed) {
    const risk = math.abs(entry - stop)
    const hitStop = dir > 0 ? low <= stop : high >= stop
    const hitTarget = dir > 0 ? high >= target : low <= target
    if (hitStop || hitTarget) {
        const r = (hitStop ? -1 : targetR) - costPct / 100 * entry / risk
        trades += 1
        wins += r > 0 ? 1 : 0
        sumR += r
        peakR = math.max(peakR, sumR)
        maxDrawR = math.max(maxDrawR, peakR - sumR)
        dir = 0
        entry = na
        stop = na
        target = na
    }
}

// 2. a new trade on a confirmed cross, when flat
const longSignal = barstate.isconfirmed && ta.crossover(fast, slow)
const shortSignal = barstate.isconfirmed && ta.crossunder(fast, slow)
if (dir == 0 && (longSignal || shortSignal) && atr > 0) {
    dir = longSignal ? 1 : -1
    entry = close
    stop = close - dir * stopAtr * atr
    target = close + dir * targetR * stopAtr * atr
}

plot(fast, "Fast EMA", color.new(color.accent, 30))
plot(slow, "Slow EMA", color.new(color.orange, 30))
plot(stop, "Stop", color.down, 1, plot.style_linebr)
plot(target, "Target", color.up, 1, plot.style_linebr)
plotshape(dir != 0 && dir[1] == 0 && dir > 0, "Long entry", shape.triangleup, location.belowbar, color.up, { size: size.small })
plotshape(dir != 0 && dir[1] == 0 && dir < 0, "Short entry", shape.triangledown, location.abovebar, color.down, { size: size.small })
plot(sumR, "Total R", color.accent, { display: display.data_window })

state t: table = table.new(position.bottom_right, 2, 5, { bgcolor: color.new(color.muted, 88), border_width: 1, border_color: color.grid })
if (barstate.islast) {
    table.cell(t, 0, 0, "Trades", { text_color: color.text, text_halign: text.align_left })
    table.cell(t, 1, 0, str.tostring(trades), { text_color: color.text })
    table.cell(t, 0, 1, "Win rate", { text_color: color.text, text_halign: text.align_left })
    table.cell(t, 1, 1, trades > 0 ? str.tostring(wins / trades * 100, "#") + "%" : "-", { text_color: color.text })
    table.cell(t, 0, 2, "Total", { text_color: color.text, text_halign: text.align_left })
    table.cell(t, 1, 2, str.tostring(sumR, "+#.#;-#.#") + "R", { text_color: sumR >= 0 ? color.up : color.down })
    table.cell(t, 0, 3, "Average", { text_color: color.text, text_halign: text.align_left })
    table.cell(t, 1, 3, trades > 0 ? str.tostring(sumR / trades, "+#.##;-#.##") + "R" : "-", { text_color: color.text })
    table.cell(t, 0, 4, "Worst drawdown", { text_color: color.text, text_halign: text.align_left })
    table.cell(t, 1, 4, str.tostring(maxDrawR, "#.#") + "R", { text_color: color.down })
}
#How it works
- Order matters. The open trade is managed first, then a new one may start, so an exit and a new entry can happen on the same bar but never in the wrong order.
- Everything happens on
barstate.isconfirmedbars: the forming bar never opens or closes a trade, so the history does not change after the fact. ris the trade's result in R minus its cost, also in R:costPctof the entry price divided by the risk.peakRandmaxDrawRtrack the worst fall of the running total from its best value.- The stop and target are plotted with
plot.style_linebr, so the lines break between trades.
#Customize it
- Long only: drop
shortSignalfrom the entry condition. - A trailing stop: on each confirmed bar,
stop = dir > 0 ? math.max(stop, close - stopAtr * atr) : math.min(stop, close + stopAtr * atr). - Your own entry: replace the two signal lines; keep everything else.
- Compare settings on the same bars: change one input at a time and note the table, not the best-looking chart.
#Run it
Any chart. More bars give more trades: a 1-hour chart over your plan's bars per run gives a few dozen. A handful of trades says very little; look at the count before the total.
#Concepts used
Strategies, state, tables, repainting.
#Forward returns after a signal
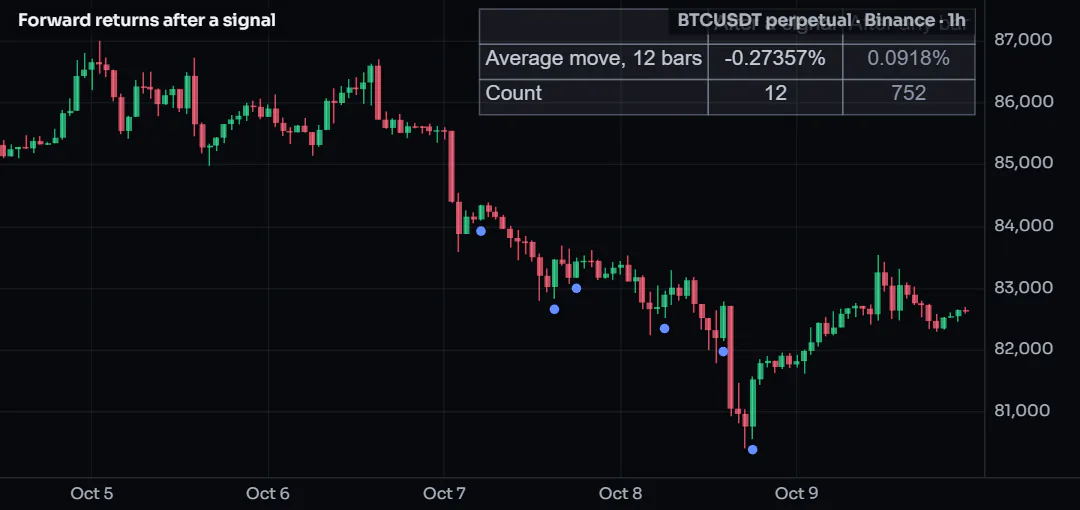
A signal is only interesting if what follows it differs from what follows any bar. This script records the move N bars after each signal, and the move N bars after every bar as the baseline, and shows both side by side.
Data: candles only. Plan: every plan.
#The script
//@chartscript 1
indicator("Forward returns after a signal", { overlay: true })
const horizon = input.int(12, "Look ahead (bars)", { minval: 1, maxval: 200 })
const rsiLen = input.int(14, "RSI length", { minval: 2 })
const level = input.float(30, "Signal: RSI crosses up through", { minval: 1, maxval: 99 })

// the signal under test, on closed bars
const rsi = ta.rsi(close, rsiLen)
const signal = barstate.isconfirmed && ta.crossover(rsi, level)

state after = array.new<float>()     // the move after each signal, in %
state baseline = array.new<float>()  // the move after every bar, in %

// `horizon` bars later the move is known: record it for the bar it belongs to
if (barstate.isconfirmed && bar_index >= horizon) {
    const move = (close - close[horizon]) / close[horizon] * 100
    baseline.push(move)
    if (signal[horizon]) {
        after.push(move)
    }
}

plotshape(signal, "Signal", shape.circle, location.belowbar, color.accent, { size: size.tiny })

state t: table = table.new(position.top_right, 3, 3, { bgcolor: color.new(color.muted, 88), border_width: 1, border_color: color.grid })
if (barstate.islast) {
    table.cell(t, 0, 0, "", {})
    table.cell(t, 1, 0, "After a signal", { text_color: color.text })
    table.cell(t, 2, 0, "After any bar", { text_color: color.muted })
    table.cell(t, 0, 1, "Average move, " + str.tostring(horizon) + " bars", { text_color: color.text, text_halign: text.align_left })
    table.cell(t, 1, 1, after.size() > 0 ? str.tostring(after.avg(), "+#.##;-#.##") + "%" : "-", { text_color: color.text })
    table.cell(t, 2, 1, baseline.size() > 0 ? str.tostring(baseline.avg(), "+#.##;-#.##") + "%" : "-", { text_color: color.muted })
    table.cell(t, 0, 2, "Count", { text_color: color.text, text_halign: text.align_left })
    table.cell(t, 1, 2, str.tostring(after.size()), { text_color: color.text })
    table.cell(t, 2, 2, str.tostring(baseline.size()), { text_color: color.muted })
}
#How it works
- A move
horizonbars ahead is only knownhorizonbars later. The script records it then, for the bar it belongs to, usingclose[horizon]andsignal[horizon]: nothing reads the future. - Two
statearrays grow by one value per closed bar: every bar intobaseline, signal bars intoafter. array.avggives the averages; the table puts the signal next to the baseline, so a market that simply went up does not make the signal look good.
#Customize it
- Test your own signal: replace the two lines under "the signal under test".
- Add the median, which is less moved by one huge bar:
after.median(). - Look at several horizons: add a second
horizoninput and a second pair of arrays.
#Run it
Any chart. Compare the two columns and look at the count: a difference over ten signals is mostly chance.
#Concepts used
Collections, history with [n], tables.
#Trades drawn as Long / Short positions
The backtest above keeps its trades in numbers. To see each trade on the chart the way you would plan it by hand, draw it with drawing.position: the chart's own Long / Short position, with its zones, prices and R:R, in the colors you saved for the tool. The position grows while the trade is open and takes the settled look when it ends. Hover one and press Edit this trade (or double-click it) to turn it into your own editable drawing.
Data: candles only. Plan: every plan.
#The script
//@chartscript 1
indicator("EMA cross trades as positions", { overlay: true, max_drawings_count: 100 })
const fastLen = input.int(20, "Fast EMA", { minval: 2 })
const slowLen = input.int(50, "Slow EMA", { minval: 3 })
const stopAtr = input.float(1.5, "Stop, x ATR", { minval: 0.1, step: 0.1 })
const targetR = input.float(2.0, "Target, in R", { minval: 0.1, step: 0.1 })

const fast = ta.ema(close, fastLen)
const slow = ta.ema(close, slowLen)
const atr = ta.atr(14)

state p: drawing = na

// manage the open trade on the bar's close (the stop first, as in the backtest)
if (!na(p) && barstate.isconfirmed) {
    const isLong = p.get_side() == "long"
    const hitStop = isLong ? low <= p.get_stop() : high >= p.get_stop()
    const hitTarget = isLong ? high >= p.get_target() : low <= p.get_target()
    if (hitStop || hitTarget) {
        p.set_to(bar_index)
        p.set_result(hitStop ? "lost" : "won")
        p = na
    } else {
        p.set_to(bar_index + 1)
    }
}
// open a trade on a confirmed cross when none is open
if (na(p) && barstate.isconfirmed) {
    if (ta.crossover(fast, slow)) {
        const stop = close - stopAtr * atr
        p = drawing.position("long", close, stop, close + targetR * (close - stop), { to: bar_index + 1, title: "Cross up" })
    } else if (ta.crossunder(fast, slow)) {
        const stop = close + stopAtr * atr
        p = drawing.position("short", close, stop, close - targetR * (stop - close), { to: bar_index + 1, title: "Cross down" })
    }
}
plot(fast, "Fast EMA", color.aqua)
plot(slow, "Slow EMA", color.orange)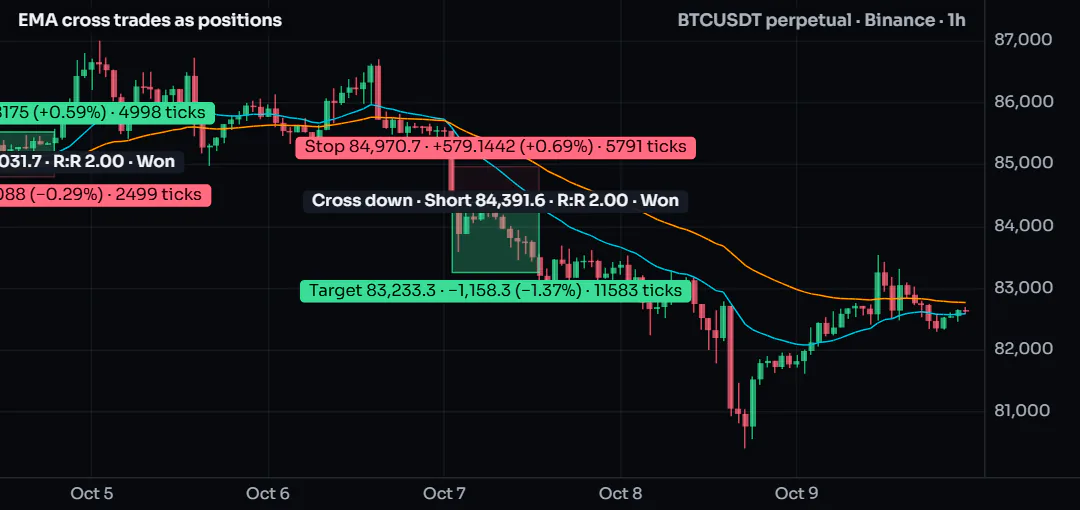
#How it works
- One
statevariable holds the open trade's position;nameans flat. - On each closed bar the open trade is checked: a stop or target ends it (
set_toon that bar,set_resultfor the settled look), otherwise it grows by one candle withset_to(bar_index + 1). - Live updates of the forming bar are undone before the next update, so the position never leaves copies behind; only the close counts.
#Customize it
- A size:
{ qty: 0.1 }makes the tags show the P&L of 0.1 coin instead of ticks. - Keep more trades on the chart:
max_drawings_countgoes up to 500. - Name the reason in the card:
{ tooltip: "Cross with RSI " + str.tostring(ta.rsi(close, 14), "0") }.
#Run it
Any chart. Hover a position for its card; press Edit this trade on the card (or double-click the position) to make it your own drawing.