

Recipes: linking scripts
Share a trend score and prior-day levels from one script and read them in others - link.script, link.confirmed, input.script and shared levels.
A script can share values (share.series, share.event, share.level) and another script can link to it and read them. That lets you build one careful script (a trend model, a set of levels) and reuse it in many others without copying its code. These recipes come in pairs: a producer that shares, then a consumer that reads.
Save each producer under the name its indicator(...) gives (Trend Score, Day Levels) before you run its consumer. The consumers write @user/Trend Score@1: @user stands for your own handle when you have not chosen one (write your handle if you have), and @1 is the first saved version. See Linking scripts for every rule.
| Recipe | What it does | What it teaches |
|---|---|---|
| Share a trend score | A producer that shares a trend score, a squeeze flag and an event when the trend flips | share.series, share.event, bool and number shares |
| Filter signals with a linked trend | An RSI that keeps its signals only when the linked trend agrees, on closed bars | link.script, link.confirmed, ready and status |
| Let the member pick the trend source | The same filter, with the producer chosen in the settings | input.script, needs |
| Share levels and draw them elsewhere | A producer that shares the prior day's high and low as levels, and a consumer that marks breaks of them | share.level, h.levels, point in time |
Plans: links work on every plan; each link uses slots of your plan (Plan slots). Without the producer: a consumer never stops. Its linked values read na, ready is false and status says why ("loading", "no access", "plan", "error"); the legend row says it too.
#Share a trend score
This producer turns three EMAs into a trend score from -1 to 1, flags when the market is in a volatility squeeze, and sends an event whenever the score changes sign. It draws its own line too: sharing changes nothing about how a script looks.
Data: candles only. Plan: every plan.
#The script
//@chartscript 1
indicator("Trend Score")
const fastLen = input.int(21, "Fast EMA", { minval: 2 })
const slowLen = input.int(55, "Slow EMA", { minval: 3 })

const fast = ta.ema(close, fastLen)
const slow = ta.ema(close, slowLen)
// +1 / -1 for each agreement, averaged: -1 (all down) to +1 (all up)
const score = (math.sign(close - fast) + math.sign(fast - slow) + math.sign(slow - slow[5])) / 3

// a squeeze: Bollinger width in the lowest fifth of its last 100 bars
const [m, up, lo] = ta.bb(close, 20, 2)
const width = (up - lo) / m
const squeeze = width <= ta.percentile_nearest_rank(width, 100, 20)

share.series("trend", score, { title: "Trend score (-1 to 1)" })
share.series("squeeze", squeeze, { title: "In a squeeze" })
if (math.sign(score) != math.sign(score[1]) && math.sign(score) != 0) {
    share.event("flip", { price: close, side: score > 0 ? 1 : -1, text: score > 0 ? "Trend turned up" : "Trend turned down" })
}

plot(score, "Trend score", score > 0 ? color.up : score < 0 ? color.down : color.muted, { style: plot.style_columns })
hline(0, "Zero", color.muted)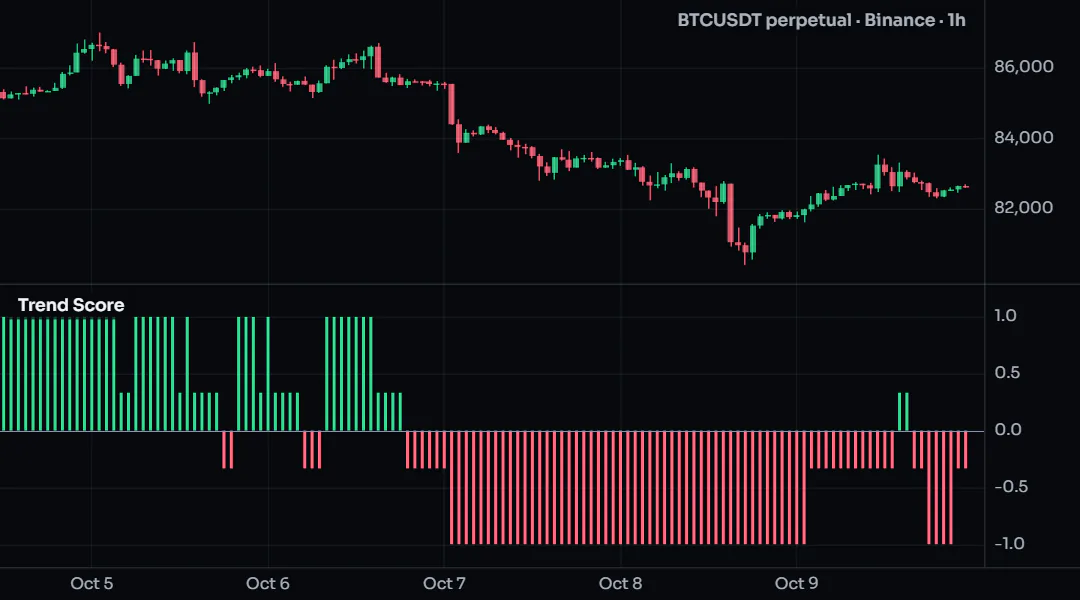
#How it works
- Each
math.sign(...)is +1, 0 or -1; three of them averaged give a score from -1 to 1. share.series(id, value, { title })shares one value per bar. It is written once, at the top level, like a plot. A bool is shared as a bool.share.eventmay be called inside anif: it is sent on the bar the trend flips, with a price, a side and a short text.- Ids are short lower-case words (
trend,squeeze,flip); the consumer reads them by these names.
#Customize it
- Share the raw EMAs too, for consumers that want them:
share.series("fast", fast). - A stricter squeeze: the lowest tenth (
10instead of20).
#Run it
Save it as Trend Score. It runs like any indicator; the Links tab of the editor lists what it shares.
#Concepts used
Linking scripts: the producer, ta.percentile_nearest_rank, tuples.
#Filter signals with a linked trend
This consumer is an ordinary RSI. It links Trend Score twice: once live, to draw the score as it moves, and once confirmed, to filter signals and alerts on values that will not change after the bar closes.
Data: candles, and the linked script. Plan: every plan. Without the producer: the filter has no opinion (ready is false), no signal is kept, and the legend says why.
#The script
//@chartscript 1
const trend = link.script("@user/Trend Score@1")
const trendC = link.script("@user/Trend Score@1", { at: link.confirmed })
indicator("RSI with a linked trend")
const len = input.int(14, "RSI length", { minval: 2 })

const rsi = ta.rsi(close, len)
const buyTurn = ta.crossover(rsi, 35)
const sellTurn = ta.crossunder(rsi, 65)

// keep a signal only when the linked trend agrees, on the confirmed handle
const longOk = buyTurn && trendC.ready && trendC.trend > 0
const shortOk = sellTurn && trendC.ready && trendC.trend < 0

plot(rsi, "RSI", color.accent, 2)
hline(65, "Upper", color.muted, hline.style_dashed)
hline(35, "Lower", color.muted, hline.style_dashed)
plot(trend.ready ? 50 + trend.trend * 10 : na, "Linked trend (around 50)", color.new(color.orange, 30), 1, plot.style_stepline)
plotshape(longOk, "Long with the trend", shape.circle, location.bottom, color.up, { size: size.tiny })
plotshape(shortOk, "Short with the trend", shape.circle, location.top, color.down, { size: size.tiny })

if (barstate.islast && !trend.ready) {
    legend.info("Trend Score: " + trend.status, "The linked script gives no values on this bar.", true)
}
alert.on(longOk, "Long with the trend", "{{ticker}} {{interval}}: RSI turned up with the linked trend")
alert.on(shortOk, "Short with the trend", "{{ticker}} {{interval}}: RSI turned down with the linked trend")
No picture: this example reads another script through a link, so it draws only next to the script it reads.
#How it works
link.script("@user/Trend Score@1")is a declaration at the top of the script;trendis its handle. A second declaration with{ at: link.confirmed }reads the same run of the producer, at no extra cost.- A shared series reads as
handle.id:trend.trendis the score on the live handle,trendC.trendon the confirmed one. - On closed bars live and confirmed are the same; on the live bar the confirmed handle keeps the last closed value, so a signal cannot appear and vanish.
readyisfalsewhen the producer has no value for the bar;statussays why, shown in the legend on the last bar.
#Customize it
- Read the flip events:
for (const e of trend.events.flip) { label.new(bar_index, rsi, e.text) }. - Run the producer with other settings:
link.script("@user/Trend Score@1", { inputs: { fastLen: 10, slowLen: 30 } }). - Follow new versions automatically:
@latestinstead of@1. - Read the squeeze flag as well: it is shared as a bool, so declare it with its type through
input.script(next recipe) asneeds: { series: ["trend", "squeeze:bool"] }and testsrc.squeeze.
#Run it
Save Trend Score first, then this script. Neither has to be on the chart: the consumer runs the producer it links. The legend row of the consumer shows "← Trend Score" while the link works.
#Concepts used
Linking scripts: the consumer, link.live and link.confirmed, ready and status.
#Let the member pick the trend source
input.script gives the same handle, but the member picks the producer in the settings. needs says what this script reads, and only scripts that share it are offered: any script that shares a number called trend will do.
Data: candles, and the chosen script. Plan: every plan. Without a source: with no producer picked, the handle reads na and the legend says "No source chosen".
#The script
//@chartscript 1
indicator("Signals filtered by any trend", { overlay: true })
const src = input.script("Trend source", { defval: "@user/Trend Score@1", needs: { series: ["trend"] } })
const len = input.int(20, "Breakout length", { minval: 2 })

const breakUp = barstate.isconfirmed && close > ta.highest(high, len)[1]
const breakDown = barstate.isconfirmed && close < ta.lowest(low, len)[1]
const agreeUp = src.ready && src.trend > 0
const agreeDown = src.ready && src.trend < 0

plotshape(breakUp && agreeUp, "Breakout with the trend", shape.triangleup, location.belowbar, color.up, { size: size.small })
plotshape(breakDown && agreeDown, "Breakdown with the trend", shape.triangledown, location.abovebar, color.down, { size: size.small })
plotshape(breakUp && !agreeUp, "Breakout against the trend", shape.xcross, location.belowbar, color.muted, { size: size.tiny })
alert.on(breakUp && agreeUp, "Breakout with the trend", "{{ticker}}: breakout confirmed by the trend source")
No picture: this example reads another script through a link, so it draws only next to the script it reads.
#How it works
input.script(title, { defval, needs })is a setting whose value is a script.defvalis the one it starts with.needs: { series: ["trend"] }makessrc.trendreadable and limits the picker to scripts that share a numbertrend.- Picking a study that is already on the chart reads it as it runs, and can follow its settings.
#Customize it
- Need a bool too:
needs: { series: ["trend", "squeeze:bool"] }, thensrc.squeeze. - Need levels:
needs: { levels: ["prior"] }(see the next recipe).
#Run it
Add it to a chart, open its settings and pick Trend Score (or any script that shares trend) under Trend source.
#Concepts used
#Share levels and draw them elsewhere
Levels are the third kind of share: a price (or a zone) that stays active until the producer ends it. Day Levels shares the prior day's high and low as soon as the day is finished; Prior-day breaks reads them and marks closes through them.
Data: candles only. Plan: every plan. Without the producer: h.levels.prior is an empty array; nothing is marked.
#The producer
//@chartscript 1
indicator("Day Levels", { overlay: true })
state dayHigh: float = na
state dayLow: float = na

// when a new UTC day starts, yesterday's range is final: share it NOW (never earlier)
if (timeframe.change("1D")) {
    if (!na(dayHigh)) {
        share.level("prior", "high", dayHigh, { name: "PDH", kind: "R", side: -1 })
        share.level("prior", "low", dayLow, { name: "PDL", kind: "S", side: 1 })
    }
    dayHigh = high
    dayLow = low
} else {
    dayHigh = math.max(dayHigh, high)
    dayLow = math.min(dayLow, low)
}
plot(dayHigh, "Today's high so far", color.new(color.down, 60), 1, plot.style_stepline)
plot(dayLow, "Today's low so far", color.new(color.up, 60), 1, plot.style_stepline)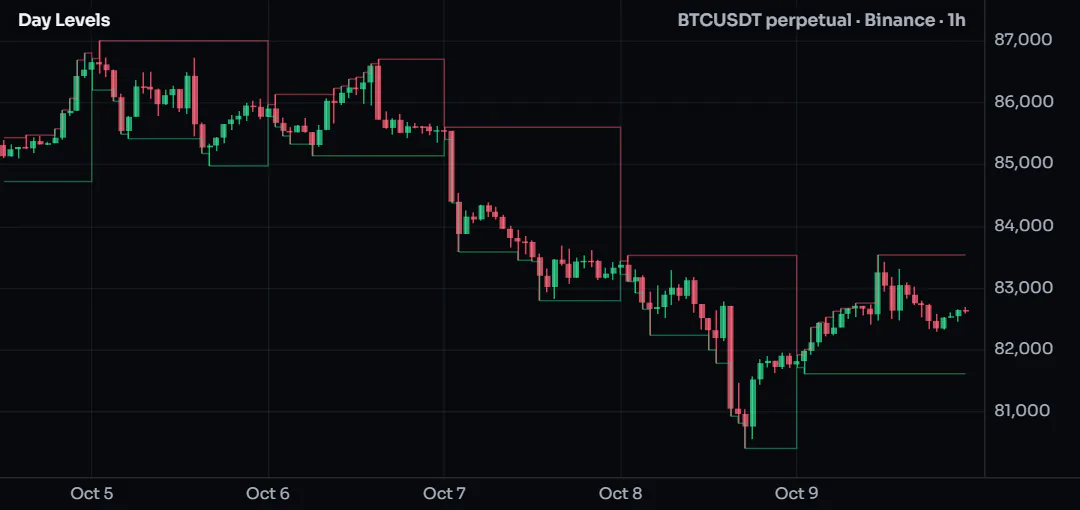
#The consumer
//@chartscript 1
const days = link.script("@user/Day Levels@1", { at: link.confirmed })
indicator("Prior-day breaks", { overlay: true })

let pdh: float = na
let pdl: float = na
for (const lv of days.levels.prior) {
    if (lv.name == "PDH") {
        pdh = lv.price
    } else if (lv.name == "PDL") {
        pdl = lv.price
    }
}
const breakUp = barstate.isconfirmed && !na(pdh) && close > pdh && close[1] <= pdh
const breakDown = barstate.isconfirmed && !na(pdl) && close < pdl && close[1] >= pdl

plot(pdh, "Prior-day high", color.down, 1, plot.style_linebr)
plot(pdl, "Prior-day low", color.up, 1, plot.style_linebr)
plotshape(breakUp, "Closed above PDH", shape.triangleup, location.belowbar, color.up, { size: size.small })
plotshape(breakDown, "Closed below PDL", shape.triangledown, location.abovebar, color.down, { size: size.small })
alert.on(breakUp, "Closed above the prior-day high", "{{ticker}} closed above yesterday's high at {{close}}")
alert.on(breakDown, "Closed below the prior-day low", "{{ticker}} closed below yesterday's low at {{close}}")
No picture: this example reads another script through a link, so it draws only next to the script it reads.
#How it works
share.level(id, key, price, { name, kind, side })creates a level, or moves it when the key exists. Keys"high"and"low"are reused every day, so each new day simply moves the two levels.- The producer shares on the first bar of the new day, the bar on which yesterday's range is known. A consumer's history therefore holds only what it could have known at the time (point in time).
days.levels.prioris an array oflevelvalues active on the bar, sorted by price; each hasprice,name,kindandside.- The consumer picks them by name inside a loop, then plots and tests them at the top level.
#Customize it
- Share the levels as a zone: add
topandbottomtoshare.level, and readlv.top/lv.bottom. - End a level when it is broken:
share.level_end("prior", "high")in the producer. - Draw the levels as level tags in the consumer.
#Run it
Save Day Levels, then Prior-day breaks, and add the consumer to an intraday chart. Days are UTC days.