Positions and your drawings
Draw trades as the chart's own Long / Short position tool with drawing.position, and read the member's own drawings with drawing.user (opt-in).
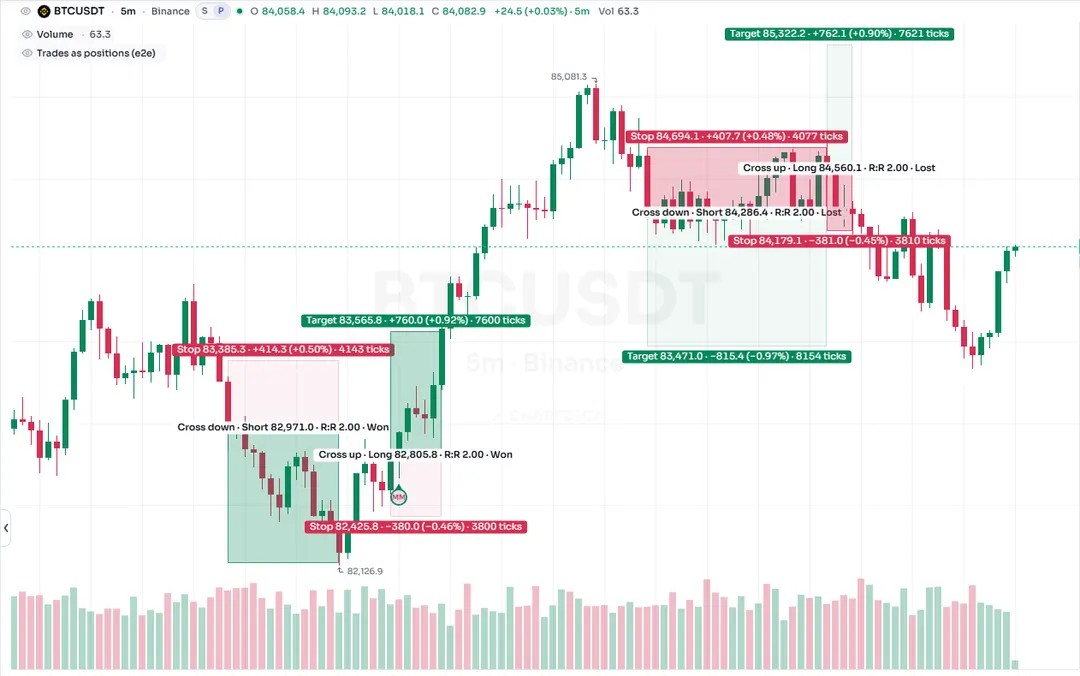
ChartDeck's drawing panel has a Long position and a Short position tool: a green zone from the entry to the target, a red zone from the entry to the stop, and tags with the prices, the move, the % and the reward to risk (R:R). A script can draw exactly that, with drawing.position. It is drawn by the tool's own code, so it looks the same as a position your member drew: the same zones and tags, the colors your member saved for the tool (Save as default in a position's settings) and the chart's theme, light or dark, on a desktop and on a phone.
A script position belongs to the script, like a box: it is drawn again with every run and it goes when the script is removed. Hovering it shows the script's card. A member who wants to change one presses Edit this trade on the card (or double-clicks the position, or right-clicks it): it becomes an ordinary Long / Short position drawing of their own with the same entry, stop, target and span, and the script's version is hidden while theirs exists, so there is only one box. That drawing is the member's: they can drag it, resize it, change it, it is saved with the layout and listed in the Drawings panel, and it stays when the script is removed. Deleting it brings the script's version back. Edit all takes every trade of the script at once.
#Placing a position
const p = drawing.position(side, entry, stop, target, { from, to, qty, title, tooltip, result, xloc })| Argument | Meaning |
|---|---|
side | "long" or "short" (drawing.side_long, drawing.side_short). Another fixed text is error CS2014; a text from an input that is not "short" draws a long. |
entry, stop, target | The three prices. |
from | The bar the position starts at. Left out (na): the current bar. |
to | The bar it ends at. Left out: 20 bars after from. Move it with set_to while the trade is open. |
qty | The size in base units (optional). With a size, the target and stop tags show the P&L instead of ticks. |
title | A short name (60 characters at most) shown first in the middle tag: Golden long · Long 26,840.5 · R:R 2.10. |
tooltip | The text of the card when the position is hovered: a plain text, or a tooltip card. The card shows two lines; Details opens the rest. Left out, the card shows the title, the side and the R:R. |
result | How the trade ended: "open" (the default), "won", "lost" or "closed". |
xloc | xloc.bar_index (the default) or xloc.bar_time to give from and to as times. |
This script places a long position on every bullish EMA cross, with the stop 1.5 ATR under the entry and the target at 2R:
//@chartscript 1
indicator("EMA cross positions", { overlay: true, max_drawings_count: 40 })
const fast = ta.ema(close, 9)
const slow = ta.ema(close, 21)
const atr = ta.atr(14)

if (ta.crossover(fast, slow) && barstate.isconfirmed) {
    const stop = close - 1.5 * atr
    drawing.position("long", close, stop, close + 2 * (close - stop), { to: bar_index + 24, title: "EMA cross" })
}
plot(fast, "Fast", color.aqua)
plot(slow, "Slow", color.orange)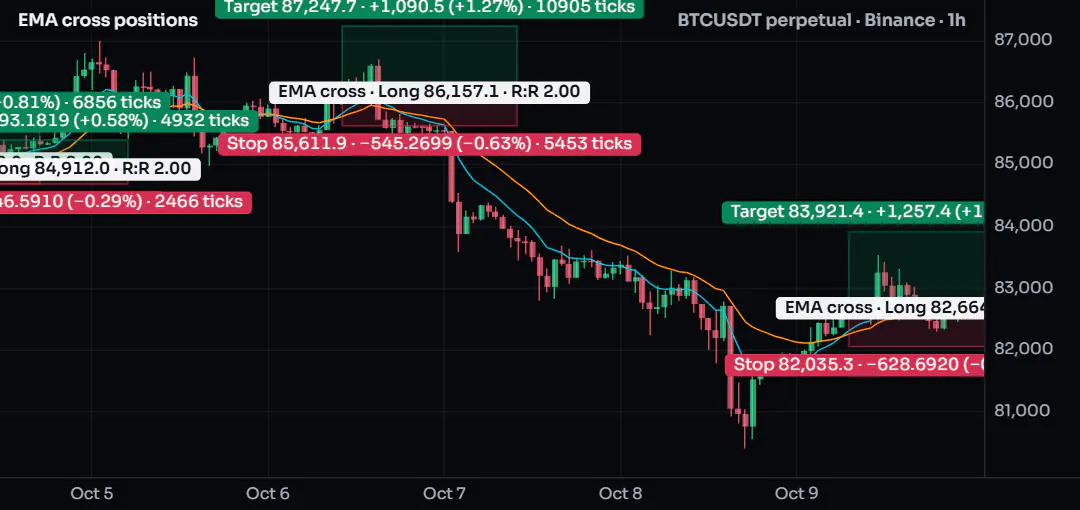
#Following a trade: setters, getters and the result
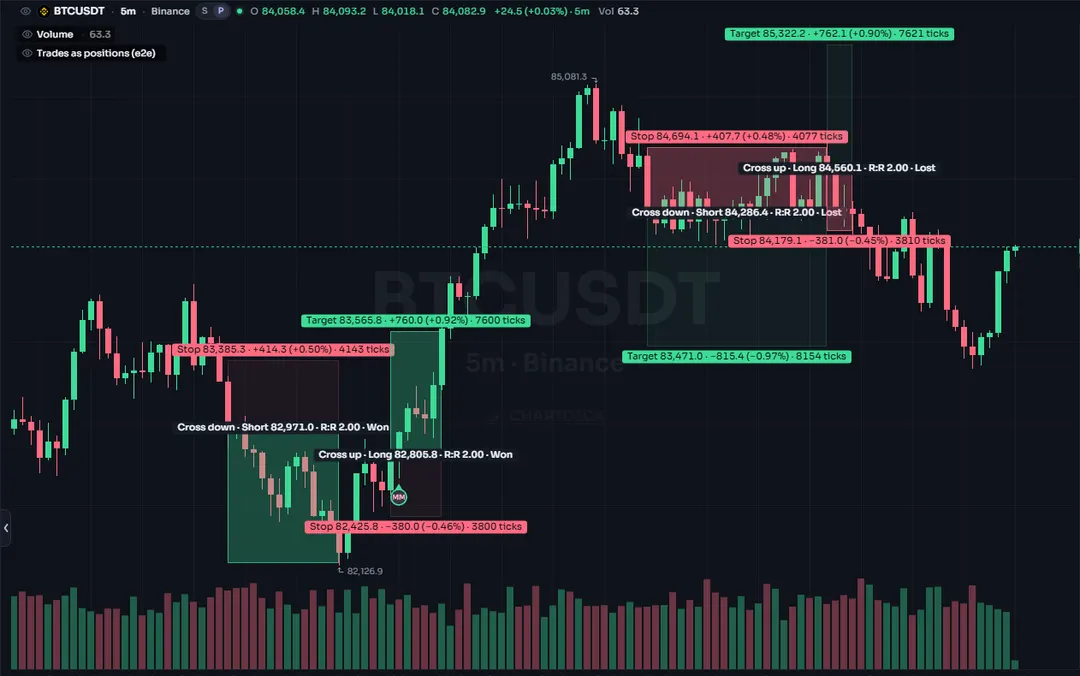
Keep the position in a state variable and change it as the trade goes on. set_to grows it, set_result gives it the settled look: the zone that was reached stays (a little stronger), the other fades, and the middle tag names the result (Won, Lost, Closed). "closed" fades both zones.
| Setters | Getters |
|---|---|
set_from(x), set_to(x) | get_from(), get_to() |
set_entry(price), set_stop(price), set_target(price) | get_entry(), get_stop(), get_target() |
set_qty(qty), set_side(side), set_result(result) | get_qty(), get_side(), get_result() |
set_title(text), set_tooltip(text) | get_title() |
drawing.delete removes a position and drawing.all lists the script's positions, oldest first.
//@chartscript 1
indicator("Breakout trade", { overlay: true })
const len = input.int(20, "Breakout length", { minval: 2 })
const hi = ta.highest(high, len)[1]
const atr = ta.atr(14)

state p: drawing = na

// a closed candle above the range opens a trade when none is open
if (barstate.isconfirmed && na(p) && close > hi) {
    p = drawing.position("long", close, close - atr, close + 2 * atr, { to: bar_index + 1, title: "Breakout", tooltip: "Close above the " + str.tostring(len) + "-bar high" })
} else if (!na(p) && barstate.isconfirmed) {
    if (low <= p.get_stop()) {
        p.set_to(bar_index)
        p.set_result("lost")
        p = na
    } else if (high >= p.get_target()) {
        p.set_to(bar_index)
        p.set_result("won")
        p = na
    } else {
        p.set_to(bar_index + 1)   // open: one candle past the last one
    }
}
No picture: this example draws with the chart’s own drawing tools, which show only on a live chart. Open it in the editor to see it.
#Budget, live bars, replay and pictures
- Budget. A script keeps 50 positions; ask for up to 500 with
indicator(..., { max_drawings_count: N }). When it makes one more, the oldest goes. - Live bars. As with boxes, everything a live update does to a position (making it, moving it, its result) is undone before the next update of the same bar; only the bar's close sticks. A position that grows each candle never leaves copies behind.
- Replay. Positions are drawn in bar replay like the script's other drawings.
- Alert pictures. When a script alert fires, the picture of the alert shows the script's positions near the firing bar (their zones and the side and R:R).
- Style tab. The switch that shows or hides a script's labels, lines, boxes and tables hides its positions too.
- Positions are drawn only where they reach the visible bars, so hundreds of them cost nothing while they are off screen.
#Reading the drawings a member made
A script can also read the drawings the member made on the chart: the horizontal lines they use as levels, their trend lines, their positions and rectangles. Use it to alert near a hand-drawn level, to count touches of the member's trend line, or to size a trade from the member's own stop.
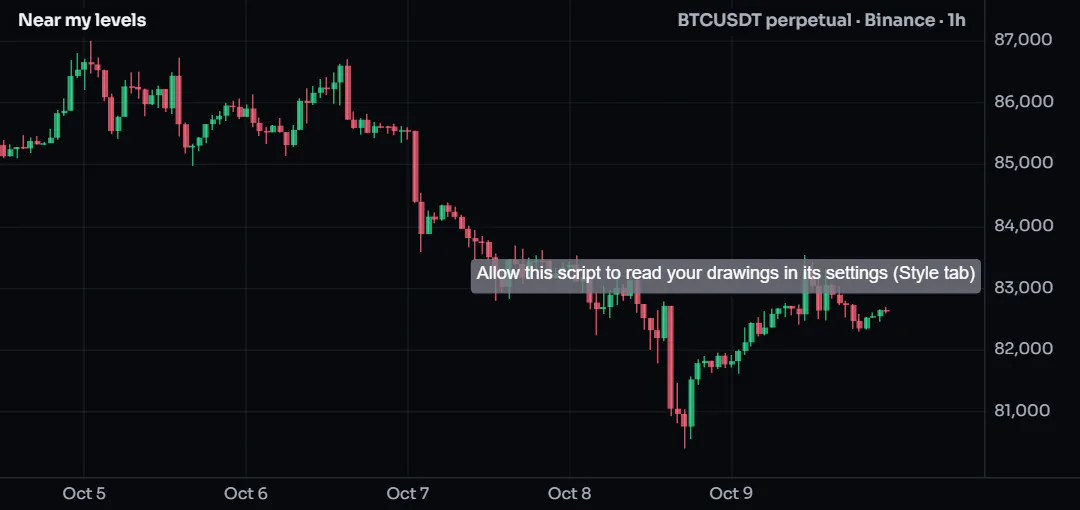
This is off until the member allows it. A script that calls drawing.user gets a new switch in its settings (Style tab): Allow this script to read my drawings on this chart. It is off by default and saved with the study, per chart. While it is off:
drawing.user(kind)returns an empty list, on every bar;drawing.user_allowedisfalse, so the script can show a hint ("turn on Allow this script to read my drawings in the settings") instead of failing silently.
When it is on, the script receives read-only copies of the member's drawings of this chart only (this market, this member; never another member's drawings, and never the drawings of other charts). When the member adds, moves or removes a drawing, the script runs again after a short pause.
kind | The member's drawings |
|---|---|
"all" (the default) | every kind below |
"hline" | horizontal lines and horizontal rays |
"trend" | trend lines, rays, extended lines, info lines and trend angles |
"position" | Long and Short positions |
"rect" | rectangles |
Each item is a drawing.user_item with the fields kind, tool, price, time, index (the first point), price2, time2, index2 (the second point), entry, stop, target, side (positions), top, bottom and text. index is the bar index of the point's time (na before the script's first bar). At most 200 drawings are read, oldest first.
Server runs see nothing. Protected scripts that run on ChartDeck's servers, script alerts and alert pictures never receive the member's drawings: there drawing.user is always empty and drawing.user_allowed is false, whatever the switch says. So a script alert never fires on a drawn level; for an alert on a level, give the level to the script as an input.
//@chartscript 1
indicator("Near my levels", { overlay: true })
const reach = input.float(0.5, "Near, x ATR", { minval: 0.1, step: 0.1 })
const atr = ta.atr(14)

let near = 0
let closest: float = na
for (const d of drawing.user("hline")) {
    const dist = math.abs(close - d.price)
    if (dist <= reach * atr) {
        near += 1
    }
    if (na(closest) || dist < math.abs(close - closest)) {
        closest = d.price
    }
}
plot(closest, "My nearest level", color.orange, { style: plot.style_circles })
bgcolor(near > 0 ? color.new(color.orange, 88) : na)
if (barstate.islast && !drawing.user_allowed) {
    label.new(bar_index, high, "Allow this script to read your drawings in its settings (Style tab)", { yloc: yloc.abovebar, color: color.new(color.gray, 20) })
}
#Other drawing tools
drawing.position is the first drawing-tool object. Fib retracements, rectangles and price ranges will follow the same pattern (drawing.fib, drawing.rect, drawing.pricerange: placed by the script, drawn by the tool, Edit this trade to make one your own); until then use boxes and lines.