

How ChartScript works
The whole mental model on one page - a script runs once per bar, what keeps its value between bars, what it can read, what it draws and where it runs.
A script is a calculation for one bar. ChartDeck runs it on every bar, oldest first, then again each time the newest bar updates. Everything else follows from that.
#1. Once per bar, oldest first
On each bar, open, high, low, close, volume and time hold that bar's values, and every plot adds one point. So this is a whole indicator:
//@chartscript 1
indicator("Bar range", { format: format.price })
plot(high - low, "Range", color.accent, { style: plot.style_columns })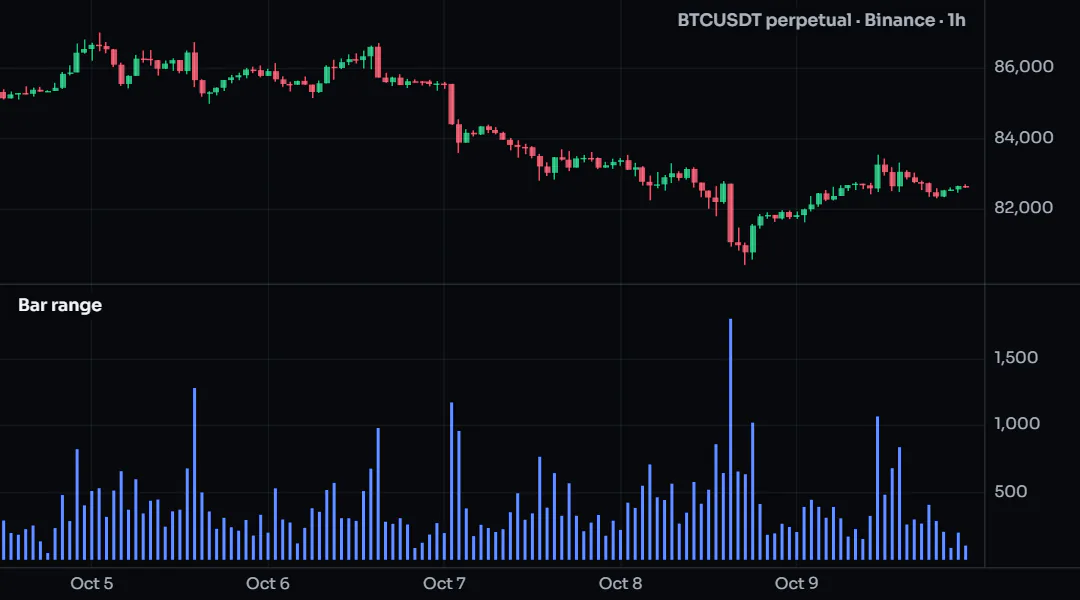
There is no loop over the bars in your code: ChartDeck repeats the script for you across the history.
#2. The live bar runs again
While the newest bar is open, the script runs again on every update of it, and its last point moves with the market. When the bar closes, its values are final. Use barstate.isconfirmed for anything that must not change after the fact (signals, alerts). See Repainting.
#3. What keeps its value between bars
| You write | On the next bar it is |
|---|---|
const x = ... or let x = ... | computed again from scratch |
state x = 0 | kept: the value the previous bar left (set once, on the first bar) |
x[1], close[5] | the value of an earlier bar (history) |
ta.ema(close, 20) and the other ta.* | kept for you inside the function |
On the live bar, every state change is rolled back before the next update, so an unfinished bar never counts twice. The execution model has the details.
#4. What a script can read
| Source | Written as | Page |
|---|---|---|
| The chart's bars | open, high, low, close, volume, time, bar_index | Bars and time |
| Other timeframes and markets | request.tf("1D", close), request.market("BINANCE:ETHUSDT", "", close) | Other timeframes and markets |
| ChartDeck's data series | flow.*, oi.*, funding.*, basis.*, lsr.*, liq.*, etf.*, fp.*, hl.* | ChartDeck data |
| Record data | flow.prints(...), liq.levels(), fp.rows(), book.depth() | Trade prints, Footprints |
| Another script's shares | link.script("@user/Name@1") | Linking scripts |
| The member's settings | input.int(...), input.bool(...) and the other inputs | Inputs |
A value that does not exist on a bar is na (a spot market has no funding, the first bars have no 20-bar average). na spreads through arithmetic and draws nothing; nz(x) turns it into 0.
#5. What a script shows
- Values:
plot,plotshape,bgcolor,barcolor,hlineandfill, one value per bar. See Plots. - Objects: labels, lines, boxes, tables, polylines and level tags that you create and move from code. See Drawings.
- Legend items and alert conditions: text in the legend row, and named conditions for Create alert. See Legend items and Alerts.
#6. Where it runs
- Your own scripts run in your browser, compiled on your device and run in a sandbox beside the chart.
- Protected Community scripts and script alerts run on ChartDeck's servers, for the plan of the member who views the chart or owns the alert, on the same bars.
- A script never places, changes or cancels an order.
#If something goes wrong
- A red underline: open the Problems tab; each code links its page in Error messages.
- A blank pane: check the legend row first (missing data, plan, a link waiting); then add
log.info(...)lines and open the Console. See Debugging. - Slow: see Performance and Limits.