
What the chart draws
What a script puts on a ChartDeck chart, on real candles: legend rows, values under the pointer, hover cards, drawings, tables, alert markers, panes.
A script draws in a few distinct places: lines and shapes over the candles or in a pane of their own, a row in the chart's legend, a card when you point at something, a table in a corner. This page shows each one on a real chart.
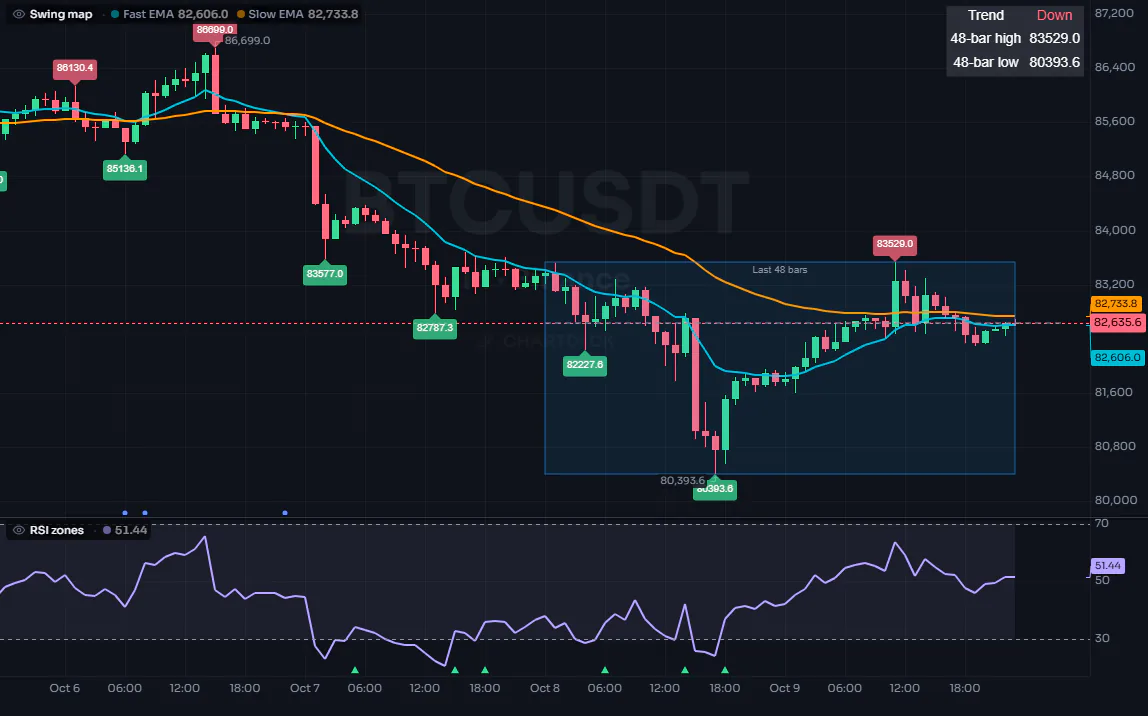
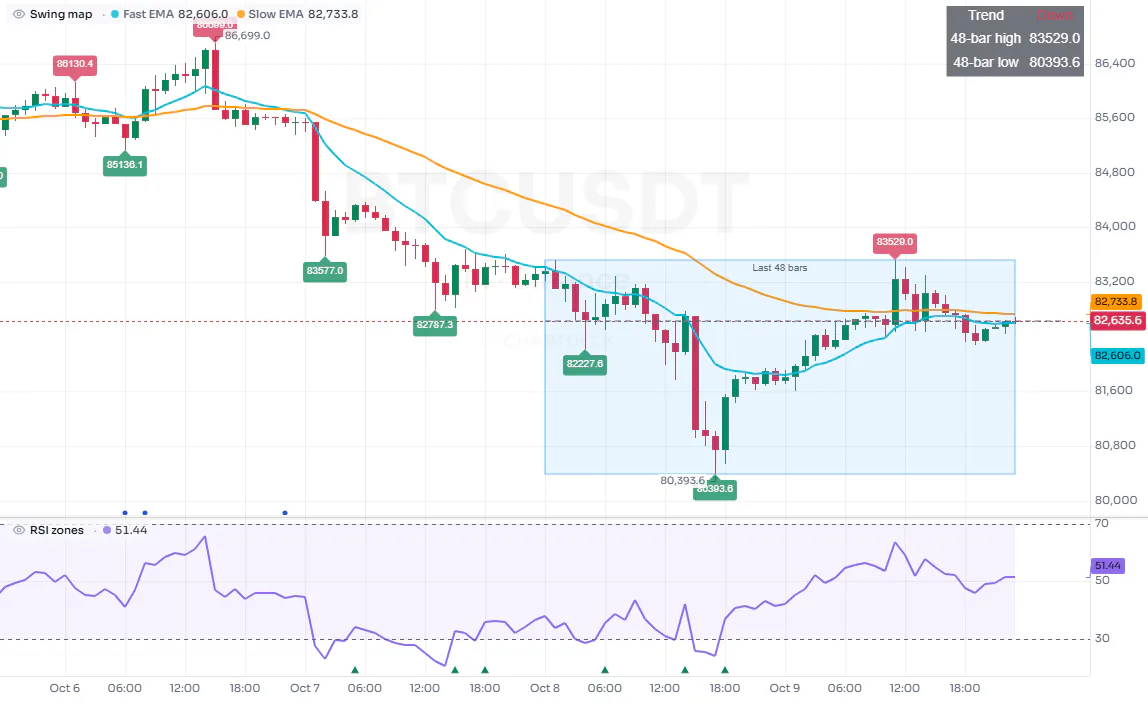
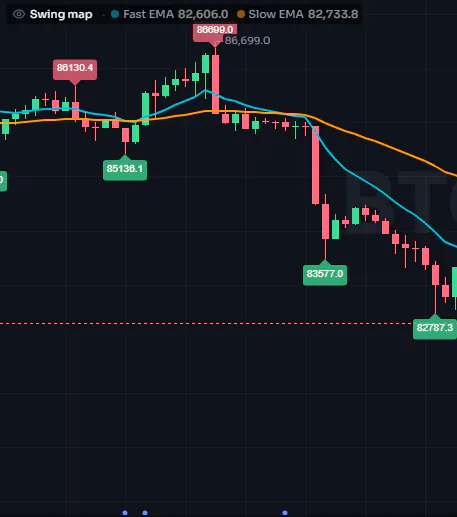
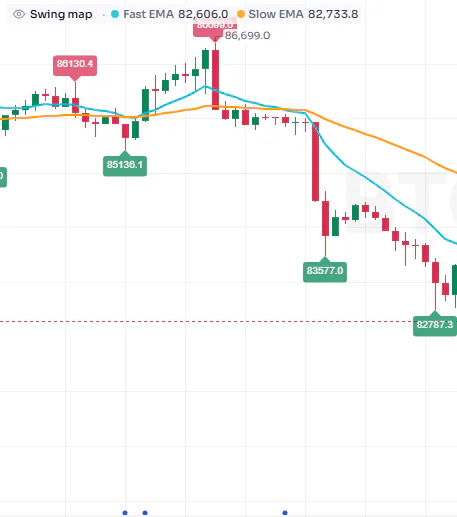
Every picture here is a screenshot of the ChartDeck terminal running the two scripts below on Binance BTCUSDT perpetual, 1 hour, 4 to 9 October 2026: recorded candles, the same ones every example picture in these docs is drawn on. Nothing was drawn by hand.
#The two scripts
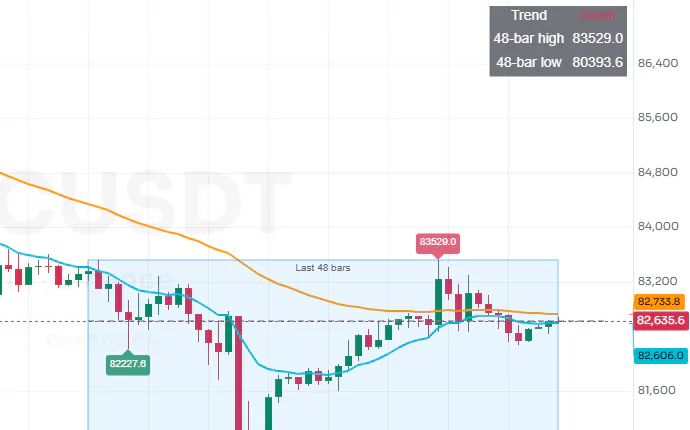
The first script draws over the candles: two moving averages, a label on every swing high and low (each with a hover card), a box around the last 48 bars, a dashed line at the last close, a small table, and two alert conditions.
//@chartscript 1
indicator("Swing map", { overlay: true, max_labels_count: 100 })
const fast = ta.ema(close, 12)
const slow = ta.ema(close, 48)
plot(fast, "Fast EMA", { color: color.aqua, linewidth: 2 })
plot(slow, "Slow EMA", { color: color.orange, linewidth: 2 })

// swing highs and lows, labelled with their price (hover a label for its card)
const span = 6
const ph = ta.pivothigh(high, span, span)
const pl = ta.pivotlow(low, span, span)
if (!na(ph)) {
    label.new(bar_index - span, ph, str.tostring(ph, format.mintick), {
        style: label.style_label_down, color: color.new(color.down, 25), textcolor: color.white, size: size.small,
        tooltip: "Swing high at " + str.tostring(ph, format.mintick) + ", confirmed " + str.tostring(span) + " bars later"
    })
}
if (!na(pl)) {
    label.new(bar_index - span, pl, str.tostring(pl, format.mintick), {
        style: label.style_label_up, color: color.new(color.up, 25), textcolor: color.white, size: size.small,
        tooltip: "Swing low at " + str.tostring(pl, format.mintick) + ", confirmed " + str.tostring(span) + " bars later"
    })
}

// the range of the last 48 bars as a box, the last close as a dashed line, and a small table
const hi = ta.highest(high, 48)
const lo = ta.lowest(low, 48)
state t: table = table.new(position.top_right, 2, 3, { bgcolor: color.new(color.black, 30) })
if (barstate.islast) {
    box.new(bar_index - 47, hi, bar_index, lo, {
        border_color: color.new(color.blue, 40), bgcolor: color.new(color.blue, 90),
        text: "Last 48 bars", text_color: color.muted, text_size: size.small, text_valign: text.align_top
    })
    line.new(bar_index - 47, close, bar_index + 5, close, { color: color.muted, style: line.style_dashed })
    t.cell(0, 0, "Trend", { text_color: color.white })
    t.cell(1, 0, fast > slow ? "Up" : "Down", { text_color: fast > slow ? color.up : color.down })
    t.cell(0, 1, "48-bar high", { text_color: color.white })
    t.cell(1, 1, str.tostring(hi, format.mintick), { text_color: color.white })
    t.cell(0, 2, "48-bar low", { text_color: color.white })
    t.cell(1, 2, str.tostring(lo, format.mintick), { text_color: color.white })
}

// alert conditions: the chart can mark the bars where each one is true
alert.on(ta.crossover(fast, slow), "Fast above slow", "{{ticker}} fast EMA crossed above the slow EMA")
alert.on(ta.crossunder(fast, slow), "Fast below slow", "{{ticker}} fast EMA crossed below the slow EMA")
The screenshots on this page show what this script draws on a chart.
The second draws in a pane of its own below the chart: an RSI, two dashed levels, the band between them, and a triangle where the RSI leaves the overbought or oversold zone.
//@chartscript 1
indicator("RSI zones")
const r = ta.rsi(close, 14)
plot(r, "RSI", { color: color.violet, linewidth: 2 })
const top = hline(70, "Overbought", color.muted, hline.style_dashed)
const bottom = hline(30, "Oversold", color.muted, hline.style_dashed)
fill(top, bottom, color.new(color.violet, 92), "Middle band")
plotshape(ta.crossunder(r, 70), "Leaves overbought",
    { style: shape.triangledown, location: location.top, color: color.down, size: size.tiny })
plotshape(ta.crossover(r, 30), "Leaves oversold",
    { style: shape.triangleup, location: location.bottom, color: color.up, size: size.tiny })
The screenshots on this page show what this script draws on a chart.
#The whole chart
#The legend row
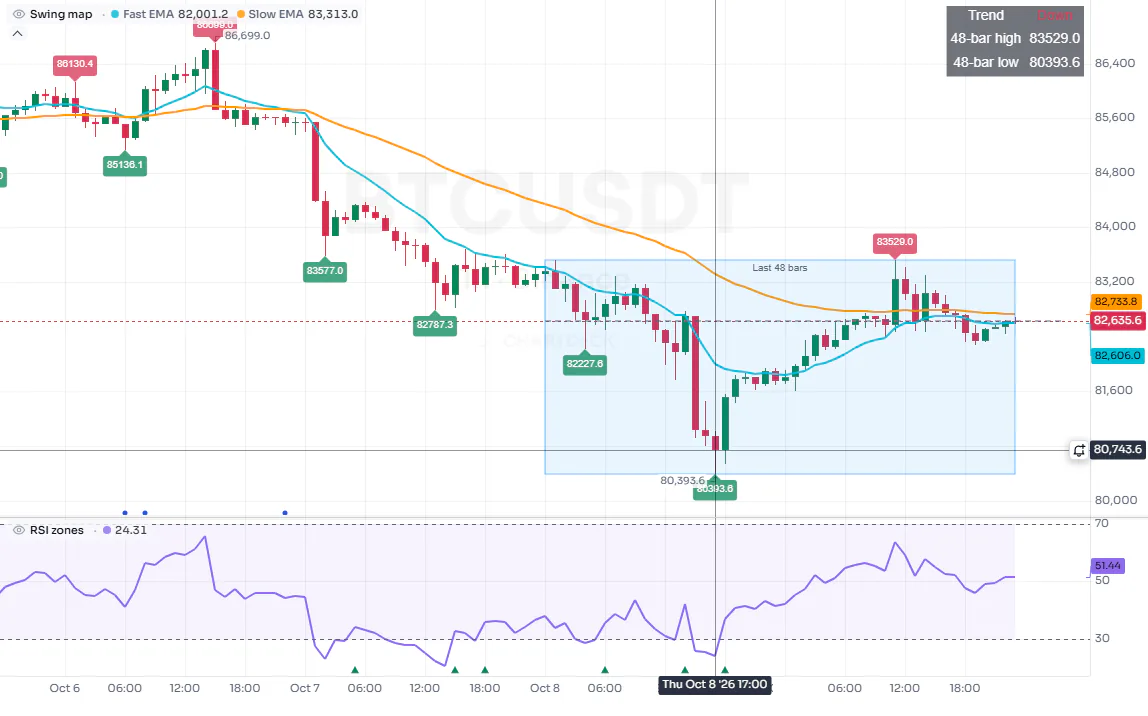
Each script on a chart gets a row in the legend at the top left of its pane: its name, then one value per plot, in the plot's color. With the pointer away from the chart, the values are those of the newest bar.


#Values under the pointer
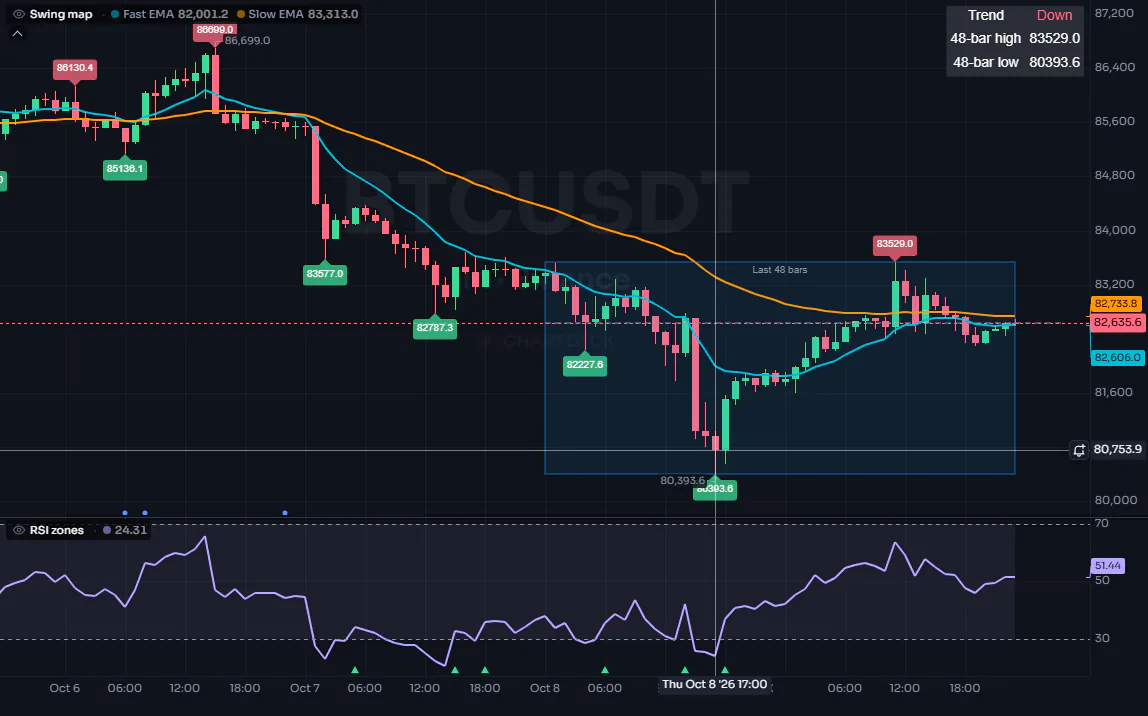
Move the pointer over the chart and the legend follows it: each value is then the value on the bar under the crosshair, so you can read a script's output on any bar of the past.
#Hover cards
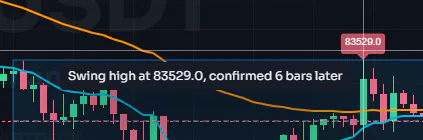
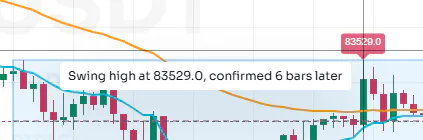
A label or a table cell with a tooltip shows it as a card when you point at it. Here the swing labels carry the price and when the swing was confirmed. The card opens beside the label; a click on the label pins it, and a long text scrolls inside it. A tooltip can also be a structured card with pages: see Tooltips and tooltip cards. See also Text and shapes and Drawings.
#Labels, lines, boxes and tables
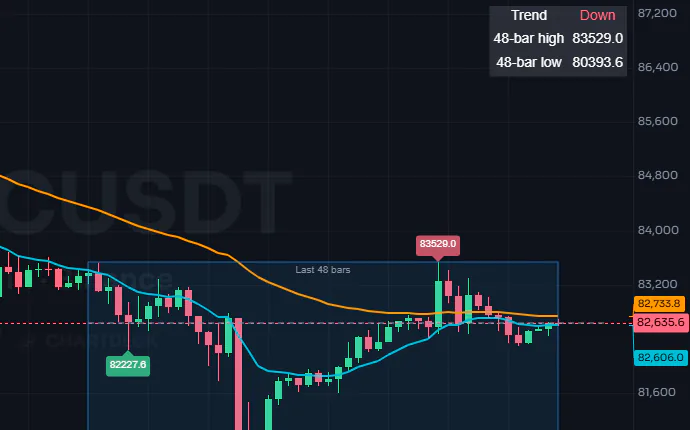
Drawings are objects your code creates at any bar and price: the price labels, the box around the last 48 bars and the dashed line are drawings, and the table at the top right is pinned to a corner of the pane whatever the scroll or zoom. See Drawings and Tables.
#Alert markers
A script with alert conditions can show a small dot under every bar where one of its conditions is true: switch on Alert conditions in the script's Style settings. It shows how often an alert would have fired before you create it. Here the dots mark the bars where the fast average crossed the slow one.
#A pane of its own
A script declared without overlay: true draws in its own pane below the chart, with its own price scale and its own legend row. Levels (hline), fills and shapes work there the same way. See Plots, Levels and Fills.


#The pictures under the examples
Every example in these docs that draws something has a picture under its code, labelled Result: that example run by the same ChartDeck engine on the same recorded candles, in the dark or light look to match the page. Click a picture to see it larger. An example that only writes to the console or sends alerts shows those lines instead, and an example that cannot be drawn on recorded candles (one that reads open interest or the order book, for instance) says why. Use Open in editor to run any example on your own chart.